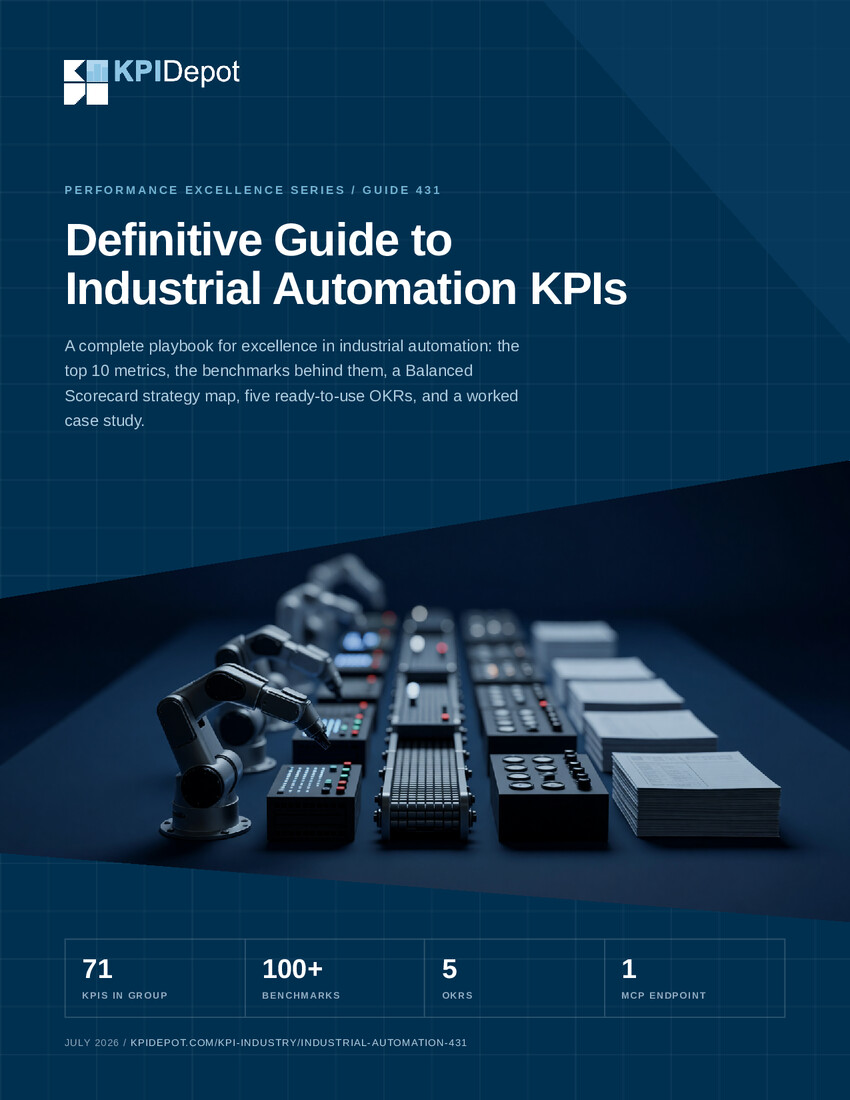
12 Most Important Industrial Automation KPIs
The top KPIs in Industrial Automation assess overall equipment effectiveness (OEE), cycle time, defect rate, and unscheduled downtime to drive productivity gains on the factory floor. Energy consumption per unit, robot utilization, and maintenance cost ratios further support continuous improvement and capital allocation.
This article showcases the Most Critical 12 KPIs for Industrial Automation and Associated Benchmarks.
1. Overall Equipment Effectiveness (OEE)
Overall Equipment Effectiveness (OEE) is a critical KPI that measures manufacturing performance by combining availability, performance, and quality.
High OEE scores indicate optimal operational efficiency, leading to improved production rates and reduced costs. This KPI directly influences financial health, as it helps identify areas for improvement and drives data-driven decision-making.
Organizations with strong OEE metrics often see enhanced ROI and better alignment with strategic goals. Learn more about the Overall Equipment Effectiveness (OEE) KPI.
View Common Pitfalls
View Improvement Levers
We have 4 benchmarks for this KPI available in our database.
Related KPI Categories
2. First Pass Yield (FPY)
First Pass Yield (FPY) is a critical KPI that measures the efficiency of production processes by indicating the percentage of products manufactured correctly without rework.
High FPY rates correlate with improved operational efficiency, reduced costs, and enhanced customer satisfaction. Companies with strong FPY performance often experience lower defect rates, which directly impacts their financial health and profitability.
By tracking FPY, organizations can identify areas for improvement, streamline operations, and align production goals with strategic objectives. Learn more about the First Pass Yield (FPY) KPI.
View Common Pitfalls
View Improvement Levers
We have 1 benchmark for this KPI available in our database.
Related KPI Categories
3. Defect Rate
Defect Rate is a critical performance indicator that reflects the quality of products or services delivered.
High defect rates can lead to increased costs, customer dissatisfaction, and potential loss of market share. Conversely, low defect rates often correlate with operational efficiency and improved financial health.
Companies that effectively track and manage this KPI can enhance their strategic alignment and drive better business outcomes. Learn more about the Defect Rate KPI.
View Common Pitfalls
View Improvement Levers
We have 5 benchmarks for this KPI available in our database.
Related KPI Categories
4. Mean Time Between Failures (MTBF)
Mean Time Between Failures (MTBF) is a critical performance indicator that reflects the reliability of systems and equipment.
High MTBF values indicate fewer failures, leading to enhanced operational efficiency and reduced downtime. This KPI directly influences financial health by minimizing repair costs and maximizing productivity.
Organizations that effectively track and analyze MTBF can make data-driven decisions that improve forecasting accuracy and strategic alignment. Learn more about the Mean Time Between Failures (MTBF) KPI.
View Common Pitfalls
View Improvement Levers
We have 1 benchmark for this KPI available in our database.
Related KPI Categories
5. Mean Time to Repair (MTTR)
Mean Time to Repair (MTTR) is a critical KPI that measures the average time taken to restore a system or component after a failure.
This metric directly influences operational efficiency, customer satisfaction, and overall financial health. A lower MTTR indicates a responsive maintenance strategy, which can enhance service reliability and reduce downtime costs.
Companies that excel in minimizing MTTR often see improved ROI metrics and better alignment with strategic goals. Learn more about the Mean Time to Repair (MTTR) KPI.
View Common Pitfalls
View Improvement Levers
We have 3 benchmarks for this KPI available in our database.
Related KPI Categories
6. Unscheduled Downtime
Unscheduled Downtime is a critical KPI that reflects operational efficiency and directly impacts financial health.
High levels of unscheduled downtime can lead to increased costs and reduced productivity, ultimately affecting profitability and customer satisfaction. By minimizing unscheduled downtime, organizations can enhance their performance indicators and improve overall business outcomes.
This metric serves as a lagging indicator, providing valuable insights into maintenance practices and resource allocation. Learn more about the Unscheduled Downtime KPI.
View Common Pitfalls
View Improvement Levers
We have 5 benchmarks for this KPI available in our database.
Related KPI Categories
7. Cycle Time
Cycle Time is a critical performance indicator that measures the efficiency of operational processes.
It directly influences business outcomes such as customer satisfaction, resource allocation, and overall profitability. A shorter cycle time often correlates with improved operational efficiency, enabling companies to respond swiftly to market demands.
Conversely, prolonged cycle times can lead to increased costs and missed opportunities. Learn more about the Cycle Time KPI.
View Common Pitfalls
View Improvement Levers
We have 1 benchmark for this KPI available in our database.
Related KPI Categories
8. Production Schedule Adherence
Production Schedule Adherence is critical for maintaining operational efficiency and ensuring timely delivery of products.
This KPI directly influences inventory management, customer satisfaction, and overall financial health. High adherence rates indicate effective production planning and resource allocation, while low rates can lead to increased costs and missed revenue opportunities.
Companies that excel in this area often leverage data-driven decision-making to optimize their processes. Learn more about the Production Schedule Adherence KPI.
View Common Pitfalls
View Improvement Levers
We have 3 benchmarks for this KPI available in our database.
Related KPI Categories
9. Capacity Utilization
Capacity Utilization measures the extent to which an organization uses its production capacity.
High utilization indicates efficient resource management, leading to improved operational efficiency and better financial health. Conversely, low utilization can signal overcapacity or inefficient processes, impacting profitability.
This KPI influences key business outcomes, including cost control and ROI metrics. Learn more about the Capacity Utilization KPI.
View Common Pitfalls
View Improvement Levers
We have 8 benchmarks for this KPI available in our database.
Related KPI Categories
10. Production Cost per Unit
Production Cost per Unit is a critical KPI that measures the efficiency of manufacturing processes and impacts overall financial health.
By tracking this metric, organizations can identify cost control opportunities, optimize resource allocation, and enhance operational efficiency. A lower production cost per unit often correlates with improved margins and profitability, enabling companies to reinvest in innovation and growth.
Conversely, high costs can signal inefficiencies that erode competitive positioning. Learn more about the Production Cost per Unit KPI.
View Common Pitfalls
View Improvement Levers
We have 1 benchmark for this KPI available in our database.
Related KPI Categories
11. Scrap Rate
Scrap Rate is a critical performance indicator that reflects operational efficiency and cost control in manufacturing processes.
High scrap rates can indicate inefficiencies, leading to increased production costs and reduced profitability. Conversely, low scrap rates suggest effective processes and quality control, contributing to improved financial health.
Organizations that monitor this KPI can better align their production strategies with business outcomes, enhancing overall ROI. Learn more about the Scrap Rate KPI.
View Common Pitfalls
View Improvement Levers
We have 10 benchmarks for this KPI available in our database.
Related KPI Categories
12. Energy Consumption per Unit
Energy Consumption per Unit is a critical KPI that measures the efficiency of resource utilization in production processes.
It directly influences operational efficiency and cost control metrics, impacting overall financial health. By tracking this metric, organizations can identify opportunities to reduce waste and improve ROI.
A lower energy consumption per unit often correlates with enhanced sustainability practices, aligning with corporate social responsibility goals. Learn more about the Energy Consumption per Unit KPI.
View Common Pitfalls
View Improvement Levers
We have 5 benchmarks for this KPI available in our database.
Related KPI Categories
These 12 Industrial Automation KPIs were selected from the KPI Depot database to balance operational efficiency and quality control. They span leading indicators like Mean Time Between Failures (MTBF) and lagging metrics such as Defect Rate, providing a comprehensive view of equipment performance, production consistency, and cost management within industrial settings.
Track Overall Equipment Effectiveness (OEE) alongside Unscheduled Downtime to diagnose whether capacity losses stem from equipment failures or scheduling issues. Monitor First Pass Yield (FPY) in relation to Scrap Rate—divergence between high FPY and elevated Scrap Rate signals quality control gaps post-inspection. A rising Mean Time to Repair (MTTR) with declining Production Schedule Adherence indicates maintenance bottlenecks disrupting planned output.
Prioritize implementing OEE first, as it aggregates Availability, Performance, and Quality into a single actionable metric. Follow with MTBF and MTTR to identify failure frequency and repair efficiency, enabling targeted maintenance improvements. These KPIs require data typically available in industrial control systems, accelerating deployment. The full Industrial Automation KPI set, with detailed formulas and benchmarks, is accessible in the KPI Depot database.
Related Best Practices
These best practice documents below are available for individual purchase from Flevy , the largest knowledge base of business frameworks, templates, and financial models available online.



