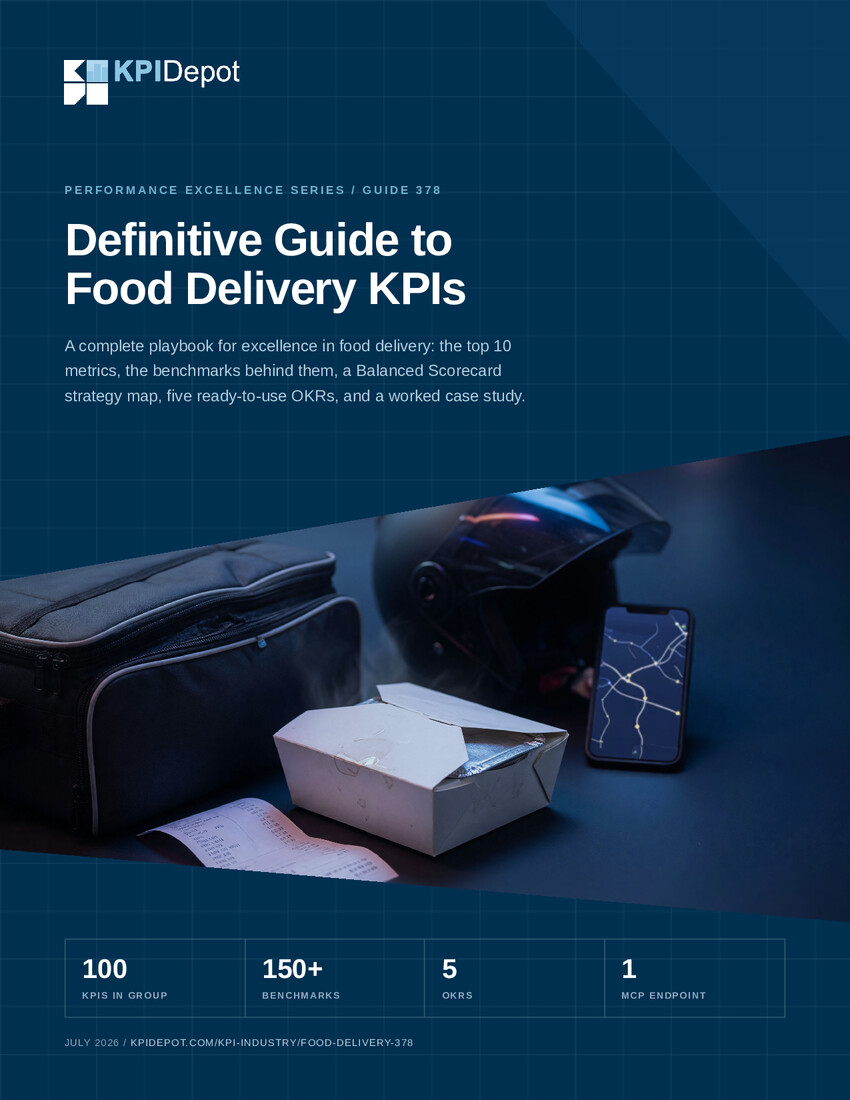
Food Delivery KPIs & Benchmarks – 100 KPIs
We have 100 KPIs on Food Delivery in our database. KPIs in the Food Delivery industry are crucial for measuring delivery efficiency, customer satisfaction, and financial performance. Delivery-related metrics, such as on-time delivery rates, order accuracy, and average delivery time, provide insights into the operational efficiency and reliability of food delivery services.
Customer-related KPIs, including satisfaction scores, repeat order rates, and net promoter scores, help gauge the acceptance and loyalty of food delivery customers. Financial KPIs, such as revenue growth, average order value, and customer acquisition cost, are essential for assessing the economic viability and market position of food delivery companies. Operational KPIs, including fleet utilization rates and delivery area coverage, are also important for optimizing resource allocation and service delivery. Marketing KPIs, such as reach and conversion rates, help in understanding the impact of promotional activities. These KPIs enable food delivery companies to refine their operations, improve customer experience, and achieve sustainable growth. By leveraging these indicators, companies can drive innovation, enhance service quality, and maintain competitive advantage in the fast-paced food delivery industry. Explore the top Food Delivery KPI benchmarks and view Food Delivery OKR examples.
Active User Growth Rate
The percentage increase in active users of the food delivery service over a specific period. It measures the service's ability to attract and retain users.
Indicates the rate at which the platform is gaining or losing active users, providing insights into market penetration and user retention.
App Download Growth Rate
The percentage increase in the number of downloads of the food delivery service’s mobile app over a specific period. It indicates the growing popularity and reach of the service.
Shows how effectively the app is attracting new users, reflecting marketing success and market demand.
Average Delivery Distance
The average distance covered for deliveries. This KPI helps in planning delivery logistics and estimating costs and time efficiencies.
Helps in understanding the operational efficiency and geographic reach of the delivery service.






















With a subscription to KPI Depot, gain access to premium KPI data for these additional KPIs:
KPI Metrics beyond Food Delivery Industry KPIs
In the Food Delivery industry, selecting the right KPIs goes beyond just industry-specific metrics. Additional KPI categories that are crucial for this sector include customer satisfaction, operational efficiency, financial performance, and technological adoption. Each of these categories provides critical insights that can help executives make informed decisions and drive organizational success. Customer satisfaction KPIs, such as Net Promoter Score (NPS) and Customer Retention Rate, are vital. They measure the overall experience and loyalty of customers, which directly impacts repeat business and word-of-mouth referrals. According to McKinsey, companies that excel in customer experience grow revenues 4-8% above their market average. Operational efficiency KPIs, such as Order Fulfillment Time and Delivery Accuracy, are essential for assessing the effectiveness of the delivery process. These metrics help identify bottlenecks and areas for improvement, ensuring timely and accurate deliveries. A study by Deloitte found that operational efficiency improvements can lead to a 10-20% reduction in costs. Financial performance KPIs, such as Gross Margin and Customer Acquisition Cost (CAC), provide insights into the organization's profitability and cost-effectiveness. These metrics are crucial for understanding the financial health of the organization and making strategic decisions. Technological adoption KPIs, such as App Performance and User Engagement, are increasingly important in the Food Delivery industry. With the rise of mobile ordering and digital platforms, tracking the performance and engagement of these technologies can provide valuable insights into user behavior and preferences. According to Gartner, organizations that invest in digital transformation are 26% more profitable than their peers. By focusing on these additional KPI categories, Food Delivery executives can gain a comprehensive understanding of their organization's performance and make data-driven decisions to drive growth and success.
Explore our KPI Library for KPIs in these other categories. Let us know if you have any issues or questions about these other KPIs.
Food Delivery KPI Implementation Case Study
Consider a leading Food Delivery organization, DoorDash, which faced significant challenges in scaling their operations and maintaining customer satisfaction during rapid growth. The organization grappled with delivery delays, high customer churn, and operational inefficiencies, impacting their overall performance and market position. DoorDash implemented a robust KPI management system to address these issues. They focused on key KPIs such as Delivery Time, Customer Satisfaction Score, and Driver Retention Rate. Delivery Time was selected to ensure timely deliveries and enhance customer experience. Customer Satisfaction Score was crucial for measuring overall customer experience and identifying areas for improvement. Driver Retention Rate was essential for maintaining a reliable and efficient delivery workforce. Through the deployment of these KPIs, DoorDash was able to identify bottlenecks in their delivery process, streamline operations, and improve driver engagement. As a result, they achieved a 15% reduction in delivery times, a 20% increase in customer satisfaction, and a 10% improvement in driver retention. The lessons learned from this case study include the importance of selecting relevant KPIs that align with organizational goals, continuously monitoring and analyzing KPI data, and making data-driven decisions to drive performance improvements. Best practices include involving key stakeholders in the KPI selection process, leveraging advanced analytics tools for real-time monitoring, and fostering a culture of continuous improvement within the organization.
FAQs about Food Delivery KPIs
What are the most important KPIs for a Food Delivery organization?
The most important KPIs for a Food Delivery organization include Delivery Time, Customer Satisfaction Score, Order Accuracy, Customer Retention Rate, Gross Margin, and Driver Retention Rate. These KPIs provide insights into operational efficiency, customer experience, and financial performance.
How can KPIs improve operational efficiency in Food Delivery?
KPIs can improve operational efficiency by identifying bottlenecks and areas for improvement in the delivery process. Metrics such as Order Fulfillment Time and Delivery Accuracy help organizations streamline operations, reduce delays, and enhance overall efficiency.
Why is Customer Satisfaction Score important in Food Delivery?
Customer Satisfaction Score is important because it measures the overall experience and satisfaction of customers. High customer satisfaction leads to repeat business, positive word-of-mouth referrals, and increased customer loyalty, which are crucial for long-term success.
How do you measure the effectiveness of delivery drivers?
The effectiveness of delivery drivers can be measured using KPIs such as Delivery Time, Order Accuracy, and Driver Retention Rate. These metrics provide insights into driver performance, reliability, and engagement, helping organizations maintain a high-quality delivery workforce.
What role do financial KPIs play in Food Delivery?
Financial KPIs, such as Gross Margin and Customer Acquisition Cost (CAC), play a crucial role in understanding the profitability and cost-effectiveness of a Food Delivery organization. These metrics help executives make strategic decisions to optimize financial performance and drive growth.
How can technological adoption KPIs benefit Food Delivery organizations?
Technological adoption KPIs, such as App Performance and User Engagement, provide valuable insights into user behavior and preferences. Tracking these metrics helps organizations enhance their digital platforms, improve user experience, and stay competitive in the market.
What are the best practices for KPI management in Food Delivery?
Best practices for KPI management in Food Delivery include selecting relevant KPIs that align with organizational goals, continuously monitoring and analyzing KPI data, involving key stakeholders in the KPI selection process, leveraging advanced analytics tools, and fostering a culture of continuous improvement.
How often should KPIs be reviewed in a Food Delivery organization?
KPIs should be reviewed regularly, typically on a weekly or monthly basis, to ensure timely identification of issues and opportunities for improvement. Regular reviews help organizations stay agile, make data-driven decisions, and continuously optimize performance.
Explore Food Delivery KPIs Deeper
Related Business Resources
These resources below, which include templates, frameworks, deliverables, and more, are available for individual purchase from Flevy , the largest online marketplace of business templates.

