Corrective Action Closure Time (CACT) is a critical KPI that measures the efficiency of resolving identified issues within an organization.
It directly influences operational efficiency, compliance adherence, and overall financial health.
A shorter CACT indicates a proactive approach to problem-solving, which can enhance customer satisfaction and reduce costs associated with delays.
Conversely, prolonged closure times can signify systemic inefficiencies and hinder strategic alignment.
Organizations that monitor CACT effectively can leverage data-driven decision-making to improve performance indicators and achieve better business outcomes.
By focusing on this KPI, companies can enhance their management reporting and ensure timely corrective actions are taken.
How Corrective Action Closure Time Connects to Your Strategy
This KPI's home is the ISO 37001 KPI group, where it sits sixteenth of fifty-one members. The headline co-metrics that lead this KPI group are Number of Reported Bribery Cases, Bribery Case Conviction Rate, and Time to Resolve Bribery Cases, in that priority order. Corrective Action Closure Time carries an internal BSC perspective, which puts it on the process side of the balanced scorecard. It reads as a lagging measure of how a corrective action moves through review and sign-off, yet it acts as a leading signal for future bribery exposure, because a control gap that stays open longer stays exploitable longer.
The genuine tension inside ISO 37001 is with Time to Resolve Bribery Cases, the third-priority member. Resolving a case fast and closing the corrective action properly pull in opposite directions: a team can mark a case resolved while the underlying corrective action is still being verified, or it can hold closure open to confirm the fix took, which stretches the clock. Reading closure time without watching case resolution flatters one number at the expense of the other.
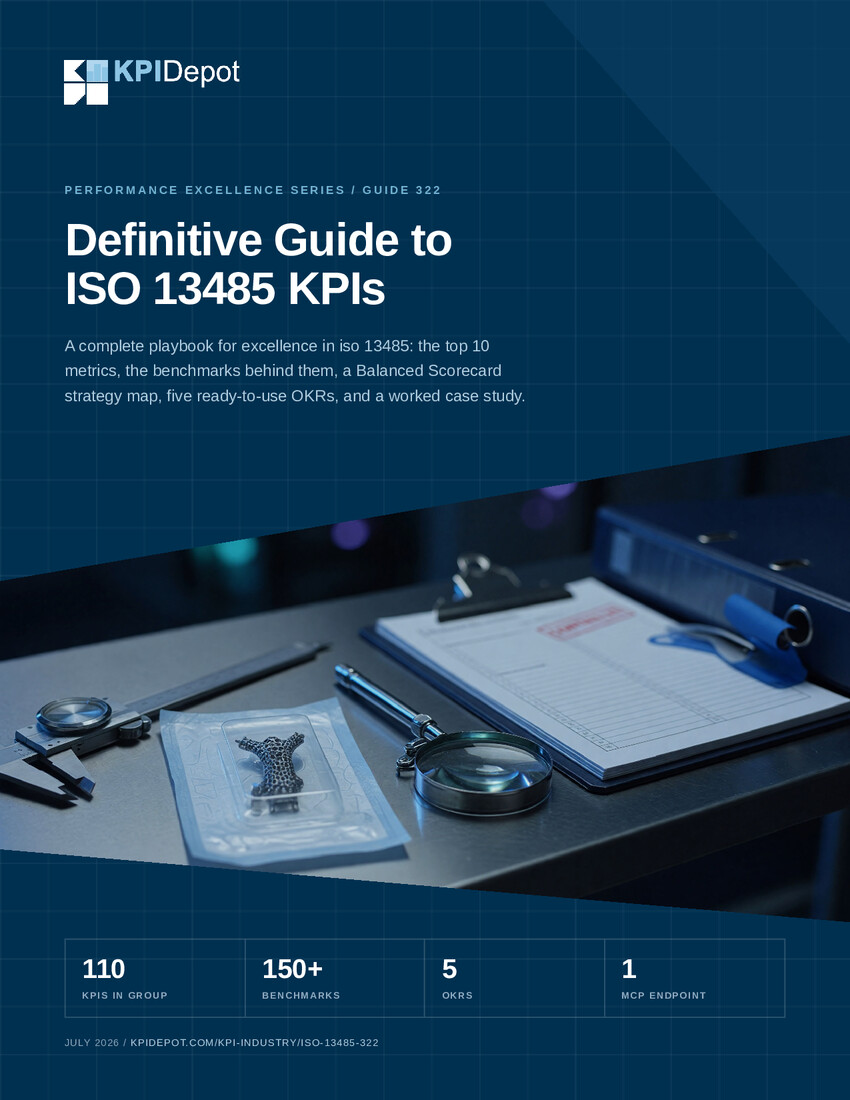
Corrective Action Closure Time also appears in the ISO 13485 KPI group for medical device quality, where it ranks thirty-third of one hundred ten. That group is led by Product Non-Conformance Rate, Customer Complaint Resolution Time, and the Corrective and Preventive Action (CAPA) Closure Rate. In this second KPI group the metric speaks to CAPA discipline rather than anti-bribery controls, and it pulls against Customer Complaint Resolution Time in the same way: closing the loop quickly can conflict with closing it thoroughly. The shared thread across both KPI groups is that this is a process-perspective cycle-time metric whose value depends entirely on how honestly the start and stop points are defined.
Measuring Corrective Action Closure Time in Practice
The underlying data for this metric lives in whatever system of record holds corrective actions: an anti-bribery case management tool for the ISO 37001 use, or a quality management system's CAPA module for the ISO 13485 use. The formula sums the time taken to close each corrective action and divides by the total number of corrective actions, so the honest join is between each action's opening timestamp and its closing timestamp. The trap is that both timestamps are policy choices, not facts. Decide before measuring whether the clock starts at the audit finding, at the moment a corrective action record is created, or at owner assignment, and whether it stops at fix deployment or at verified effectiveness. Mixing these definitions across records makes the average meaningless.
The forks that most distort this metric are population and status. If overdue or reopened actions are dropped from the denominator, the average looks faster than reality. If long-running verifications are excluded, the same bias appears. Segment the population before comparing anything: by criticality or severity, by whether an action was routed through a standard or an expedited path, and by source of the finding, since audit-driven actions often behave differently from complaint-driven or whistleblower-driven ones. An average across all of these hides the segments that actually carry risk.
The instrumentation pitfalls specific to this metric are survivorship and truncation. Reporting only closed actions in a period ignores the still-open ones that are dragging longest, which is precisely the tail a compliance or quality team needs to see. Backdating a closure to when work finished rather than when it was recorded understates cycle time. Reopened actions that get a fresh record rather than reviving the original inflate the count and deflate the average. Instrument the open population and the reopened population deliberately, and treat any single headline average as a summary that must be read next to its distribution.
Common Pitfalls
Many organizations underestimate the impact of delayed corrective actions on their overall performance.
- Failing to prioritize corrective actions can lead to unresolved issues festering over time. This neglect can result in increased costs and operational inefficiencies that affect the bottom line.
- Inadequate tracking of corrective actions often results in missed deadlines. Without a clear reporting dashboard, teams may struggle to measure progress and accountability.
- Overlooking the importance of root cause analysis can perpetuate recurring issues. Addressing symptoms rather than underlying problems leads to a cycle of inefficiency.
- Neglecting cross-departmental collaboration hinders effective problem resolution. Silos can prevent the sharing of critical insights and delay the implementation of corrective measures.
Improvement Levers
Enhancing corrective action closure time requires a strategic focus on process optimization and accountability.
- Implement a centralized tracking system for corrective actions to improve visibility and accountability. This allows teams to measure progress and identify bottlenecks in real-time.
- Encourage a culture of continuous improvement by regularly reviewing and updating processes. Engaging employees in identifying inefficiencies fosters ownership and accelerates resolution times.
- Utilize data analytics to identify trends in corrective actions. This quantitative analysis can reveal patterns that inform strategic adjustments and enhance operational efficiency.
- Provide training for teams on effective problem-solving techniques. Equipping employees with the right tools and methodologies can streamline the closure process and improve outcomes.






















Corrective Action Closure Time Benchmarks
We have 8 relevant benchmarks in our benchmarks database.
Source: Subscribers only
Source Excerpt: Subscribers only
Additional Comments: Subscribers only
| Value | Unit | Type | Company Size | Time Period | Population | Industry | Geography | Sample Size |
| Subscribers only | days | threshold | 2022 | overdue CAPA issues by criticality | quality management (life sciences/manufacturing) |
Compare KPI Depot Plans Login
Source: Subscribers only
Source Excerpt: Subscribers only
Additional Comments: Subscribers only
| Value | Unit | Type | Company Size | Time Period | Population | Industry | Geography | Sample Size |
| Subscribers only | days | industry benchmark | 2025 | CAPA implementation/closure | medical device and pharmaceutical |
Compare KPI Depot Plans Login
Source: Subscribers only
Source Excerpt: Subscribers only
Additional Comments: Subscribers only
| Value | Unit | Type | Company Size | Time Period | Population | Industry | Geography | Sample Size |
| Subscribers only | days | typical range | 2026 | FDA-regulated CAPAs (device/pharma) | medical device and pharmaceutical | United States |
Compare KPI Depot Plans Login
Source: Subscribers only
Source Excerpt: Subscribers only
Additional Comments: Subscribers only
| Value | Unit | Type | Company Size | Time Period | Population | Industry | Geography | Sample Size |
| Subscribers only | days | average cycle time | 2022 | baseline and fast-track CAPAs | medical device | 553 CAPAs |
Compare KPI Depot Plans Login
Source: Subscribers only
Source Excerpt: Subscribers only
Additional Comments: Subscribers only
| Value | Unit | Type | Company Size | Time Period | Population | Industry | Geography | Sample Size |
| Subscribers only | days | distribution | 2022 | pilot CAPAs | medical device | 553 CAPAs |
Compare KPI Depot Plans Login
Source: Subscribers only
Source Excerpt: Subscribers only
Additional Comments: Subscribers only
| Value | Unit | Type | Company Size | Time Period | Population | Industry | Geography | Sample Size |
| Subscribers only | calendar days | threshold | corrective action requests | rail sector quality management (IRIS/ISO 22163) | global |
Compare KPI Depot Plans Login
Source: Subscribers only
Source Excerpt: Subscribers only
Additional Comments: Subscribers only
| Value | Unit | Type | Company Size | Time Period | Population | Industry | Geography | Sample Size |
| Subscribers only | calendar days | threshold | non-conformances | food manufacturing | global |
Compare KPI Depot Plans Login
Source: Subscribers only
Source Excerpt: Subscribers only
Additional Comments: Subscribers only
| Value | Unit | Type | Company Size | Time Period | Population | Industry | Geography | Sample Size |
| Subscribers only | days | threshold | non-conformities | food safety | global |
Compare KPI Depot Plans Login
Browse the Top Benchmarked KPIs in ISO 37001
Reading the Benchmarks for Corrective Action Closure Time
The tracked sources agree on the shape of this metric and disagree on almost everything that makes a number comparable, starting with when the clock starts and when it stops. AssurX frames closure timing around overdue issues by criticality, so the implicit clock begins at a criticality classification and the population is items already past a due date, not every corrective action opened. MDIC, drawing on a body of medical device CAPAs, treats the metric as an average cycle time and separates baseline work from fast-track work, which means the same organization can report very different durations depending on which lane a corrective action was routed through. Before trusting any external figure, a customer has to ask which event each source calls the opening event: the audit finding, the formal CAPA record creation, or the assignment of an owner.
The stop point splits the sources just as sharply. SimplerQMS discusses closure in terms of implementation and closure of the CAPA, which invites the open question of whether a corrective action counts as closed when the fix is deployed or only after effectiveness has been verified. That open versus verified-closed distinction moves the number materially, because verification can add a long tail that some methodologies include and others exclude. Assyro looks at the same territory through an FDA-regulated lens for device and pharmaceutical CAPAs in the United States, so its notion of an acceptable closed state is shaped by regulatory expectations that a purely operational tracker would not apply.
Denominator and population choices complete the divergence. One source scopes to overdue items, another to FDA-regulated CAPAs, another to a mix of baseline and pilot corrective actions in a medical device dataset. Geography narrows in the United States case and is unstated elsewhere, and the time periods sit across separate years, so a figure that looks like an industry norm may rest on a population that does not match the customer's own. The practical takeaway is that a free closure-time number tells a customer nothing until the source's opening trigger, closing definition, and denominator are all known, which is exactly what source-attributed data supplies and a loose figure does not.
OKRs That Use Corrective Action Closure Time
Within the ISO 37001 KPI group, this metric ladders to the real objective to accelerate detection and resolution of bribery cases to limit organizational impact. That objective's own key results include raising the Corrective Actions Implementation Rate, and Corrective Action Closure Time is the timing companion to that rate: a team can hold implementation high while closure drifts slow, so closure time keeps the objective honest about speed as well as completion. Framed as a key result, a team would set a directional goal to compress closure time for high-criticality corrective actions period over period, treating any specific target as an illustrative internal aim rather than an external norm.
A second framing draws on the ISO 37001 best practice of shortening detection and resolution timelines together. Here Corrective Action Closure Time serves as a key result under an objective to build a responsive enforcement cycle, paired with faster case resolution so that speed at the front of the process does not simply push delay to the back. The directional key result is to reduce the closure clock for audit-driven actions while holding verification quality steady, a paired goal that resists the temptation to close actions fast by loosening what closed means.
KPI Categories
This KPI is associated with the following categories and industries in our KPI database:


KPI Depot takes you from KPI intelligence to finished deliverable. Consultants, strategy teams, FP&A leaders, and analytics teams use it to answer the two hardest questions in performance management, what to measure and what the target should be, and then to produce the scorecard itself.
The difference is intelligence, not just data. Anyone can list metrics. Every KPI in KPI Depot carries 13 practical attributes, from formula and measurement approach to diagnostic questions, risk warnings, and Balanced Scorecard perspective, across 15 corporate functions and 153 industries. And every target you set is grounded in our database of 34,304 source-attributed benchmarks, each detailing metric value, company size, time period, industry, geography, sample size, and source. Benchmark data at this scale is otherwise the domain of research services costing thousands to hundreds of thousands of dollars per year.
When your metrics are selected, KPI Depot finishes the job: export an interactive Strategy Map, a Balanced Scorecard with formulas and tracking columns, or a CSV KPI pack, and go from research to working deliverable in hours instead of weeks.
Formerly the Flevy KPI Library, KPI Depot is trusted by teams at organizations including Accenture, EY, IBM, PepsiCo, Samsung, and Vodafone.
Got a question? Email us at [email protected].
FAQs about Corrective Action Closure Time
What is a good target for CACT?
A good target for Corrective Action Closure Time typically ranges from 30 to 45 days, depending on the industry. This timeframe allows organizations to address issues effectively while minimizing operational disruptions.
How can CACT impact financial health?
Long closure times can lead to increased costs and reduced customer satisfaction, ultimately affecting revenue. By improving CACT, organizations can enhance their financial ratios and overall profitability.
What tools can help track CACT?
Digital tracking systems and management reporting software are effective tools for monitoring CACT. These solutions provide real-time insights and facilitate better decision-making.
How often should CACT be reviewed?
CACT should be reviewed regularly, ideally on a monthly basis. Frequent reviews help identify trends and areas for improvement, ensuring timely corrective actions.
Can CACT influence customer satisfaction?
Yes, shorter CACT can lead to quicker resolutions of issues, enhancing customer satisfaction. Timely corrective actions demonstrate a commitment to quality and responsiveness.
What role does data play in improving CACT?
Data-driven decision-making is crucial for identifying inefficiencies and optimizing processes. Analyzing CACT data can reveal patterns that inform strategic adjustments and improve closure times.
Each KPI in our knowledge base includes 13 attributes.
KPI Definition
A clear explanation of what the KPI measures
Potential Business Insights
The typical business insights we expect to gain through the tracking of this KPI
Measurement Approach
An outline of the approach or process followed to measure this KPI
Standard Formula
The standard formula organizations use to calculate this KPI
Trend Analysis
Insights into how the KPI tends to evolve over time and what trends could indicate positive or negative performance shifts
Diagnostic Questions
Questions to ask to better understand your current position is for the KPI and how it can improve
Actionable Tips
Practical, actionable tips for improving the KPI, which might involve operational changes, strategic shifts, or tactical actions
Visualization Suggestions
Recommended charts or graphs that best represent the trends and patterns around the KPI for more effective reporting and decision-making
Risk Warnings
Potential risks or warnings signs that could indicate underlying issues that require immediate attention
Tools & Technologies
Suggested tools, technologies, and software that can help in tracking and analyzing the KPI more effectively
Integration Points
How the KPI can be integrated with other business systems and processes for holistic strategic performance management
Change Impact
Explanation of how changes in the KPI can impact other KPIs and what kind of changes can be expected
BSC Perspective
NEW Mapping to a Balanced Scorecard perspective (financial, customer, internal process, learning & growth)
Explore KPI Depot by Function & Industry

