Energy Efficiency Index (EEI) measures how effectively an organization utilizes energy resources, impacting both operational efficiency and cost control.
A higher EEI indicates better energy management, which can lead to significant cost savings and improved financial health.
Companies with a strong EEI often experience enhanced sustainability profiles, attracting eco-conscious investors.
By tracking this KPI, organizations can make data-driven decisions that align with strategic goals, ultimately boosting ROI.
Effective management reporting on EEI can also facilitate variance analysis, helping to benchmark performance against industry standards.
How Energy Efficiency Index Connects to Your Strategy
Energy Efficiency Index turns up in three KPI groups that do not obviously belong together: Natural Foods, Industrial Automation, and Manufacturing. In the two production-focused groups it sits among the operational metrics it naturally pairs with. In Industrial Automation, ranked twenty-second, its neighbors are Overall Equipment Effectiveness (OEE), First Pass Yield (FPY), and Cycle Time; in Manufacturing, ranked forty-second, it sits with OEE, First-Pass Yield, Throughput Rate, and Capacity Utilization. In Natural Foods it is more of an outlier, a lone operational-efficiency measure in a group otherwise about sales growth and customer loyalty.
Its internal-perspective placement marks it as an operational efficiency signal: energy consumed per unit of output, a cousin of the yield and utilization metrics it sits beside. Lower is better, since the index rises when a plant burns more energy for the same production.
The tension is with the throughput and utilization metrics in the same groups. Pushing Throughput Rate, Capacity Utilization, or OEE harder does not automatically improve energy per unit, and often works against it: running equipment above its efficient operating point, or holding lines hot through idle periods to protect uptime, lifts the output metrics while quietly raising energy per unit. A plant optimizing OEE alone can watch Energy Efficiency Index drift the wrong way. Read the two together, because the cheapest unit to make is rarely the one made at maximum speed regardless of energy.
Measuring Energy Efficiency Index in Practice
The formula is total energy used over total production output, and both the numerator and the denominator carry hidden choices that decide whether two plants can be compared at all.
On energy, decide what is counted. Electricity alone, or electricity plus gas, steam, and other fuels, gives very different totals, and site energy differs from primary energy once generation losses are counted. Decide the boundary too: whether the figure covers only production lines or the whole site including heating, cooling, and offices. A line-level index and a whole-site index are not the same metric, and mixing them across facilities produces a ranking that reflects boundary choices as much as real efficiency.
On output, decide the unit. Energy per item, per tonne, and per unit of value-added move differently as product mix shifts, so a plant that changes what it makes can show a swing in the index with no change in how efficiently it runs. Where product mix or weather varies, normalize for them, or the index will track the seasons and the order book rather than the process.
Source energy from meters and utility records and output from the production system, joined over the same period rather than eyeballed. Segment by line, by product, and by energy type, because a site-wide index hides the one line or the one energy stream where most of the waste actually sits.
Common Pitfalls
Many organizations overlook the importance of regular energy audits, which can lead to missed opportunities for improvement.
- Failing to engage employees in energy-saving initiatives often results in low participation and lack of awareness. Without a culture of energy efficiency, even the best strategies can falter.
- Neglecting to invest in modern energy management systems can hinder tracking and reporting capabilities. Outdated systems may not provide the analytical insights necessary for informed decision-making.
- Ignoring fluctuations in energy prices can distort budgeting and forecasting accuracy. Organizations may find themselves unprepared for sudden increases in costs, affecting overall financial ratios.
- Overcomplicating energy efficiency programs can confuse stakeholders and dilute focus. Clear, actionable strategies are essential for driving engagement and achieving measurable results.
Improvement Levers
Enhancing energy efficiency requires a multifaceted approach that combines technology, employee engagement, and ongoing evaluation.
- Implement smart metering systems to track energy consumption in real-time. This allows for precise measurement and benchmarking against targets, facilitating proactive adjustments.
- Conduct regular training sessions to educate employees on energy-saving practices. Empowering staff with knowledge fosters a culture of accountability and encourages innovative solutions.
- Invest in energy-efficient technologies, such as LED lighting and high-efficiency HVAC systems. These upgrades can significantly reduce consumption and improve overall operational efficiency.
- Establish a cross-functional energy management team to oversee initiatives and track results. This team can ensure strategic alignment across departments and maintain focus on energy goals.






















Energy Efficiency Index Benchmarks
We have 5 relevant benchmarks in our benchmarks database.
Source: Subscribers only
Source Excerpt: Subscribers only
Formula: Subscribers only
Additional Comments: Subscribers only
| Value | Unit | Type | Company Size | Time Period | Population | Industry | Geography | Sample Size |
| Subscribers only | thousand Btu per dollar of value of shipments | industry aggregate ratio | all establishments | 2018 | manufacturing establishments, NAICS 311 Food | Food manufacturing (NAICS 311) | United States |
Compare KPI Depot Plans Login
Source: Subscribers only
Source Excerpt: Subscribers only
Formula: Subscribers only
Additional Comments: Subscribers only
| Value | Unit | Type | Company Size | Time Period | Population | Industry | Geography | Sample Size |
| Subscribers only | thousand Btu per dollar of value of shipments | industry aggregate ratio | all establishments | 2022 | manufacturing establishments, NAICS 3115 | Dairy Product Manufacturing (NAICS 3115) | United States |
Compare KPI Depot Plans Login
Source: Subscribers only
Source Excerpt: Subscribers only
Formula: Subscribers only
Additional Comments: Subscribers only
| Value | Unit | Type | Company Size | Time Period | Population | Industry | Geography | Sample Size |
| Subscribers only | thousand Btu per dollar of value of shipments | industry aggregate ratio | all establishments | 2022 | manufacturing establishments, NAICS 3114 | Fruit and Vegetable Preserving and Specialty Food (NAICS 3114) | United States |
Compare KPI Depot Plans Login
Source: Subscribers only
Source Excerpt: Subscribers only
Formula: Subscribers only
Additional Comments: Subscribers only
| Value | Unit | Type | Company Size | Time Period | Population | Industry | Geography | Sample Size |
| Subscribers only | thousand Btu per dollar of value added | industry aggregate ratio | all establishments | 2022 | manufacturing establishments, NAICS 311 Food | Food manufacturing (NAICS 311) | United States |
Compare KPI Depot Plans Login
Source: Subscribers only
Source Excerpt: Subscribers only
Formula: Subscribers only
Additional Comments: Subscribers only
| Value | Unit | Type | Company Size | Time Period | Population | Industry | Geography | Sample Size |
| Subscribers only | thousand Btu per dollar of value of shipments | industry aggregate ratio | all establishments | 2022 | manufacturing establishments, NAICS 311 Food | Food manufacturing (NAICS 311) | United States |
Compare KPI Depot Plans Login
Browse the Top Benchmarked KPIs in Natural Foods
OKRs That Use Energy Efficiency Index
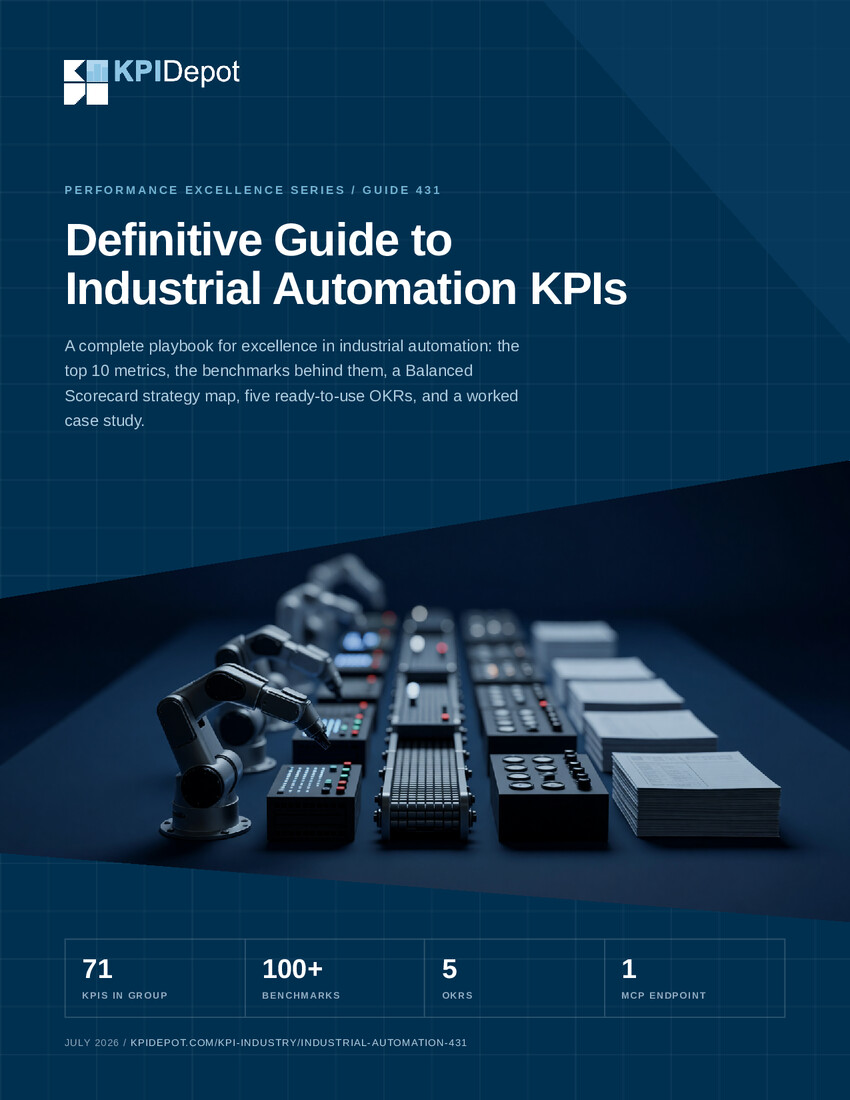
Two of the three groups give this metric a clear OKR home. Industrial Automation frames an objective to drive cost efficiency through reduced maintenance and optimized resource use, and energy is one of the largest resources a plant consumes, so Energy Efficiency Index fits directly as a key result: a team can aim to lower energy per unit of output over the year as part of that cost-efficiency push. Manufacturing frames an objective to maximize equipment and process efficiency, where the index belongs beside yield and utilization results as the energy dimension of the same efficiency drive.
The discipline in both is to pair an energy target with the output metrics rather than chase it alone. Cutting energy per unit is easy to fake by running fuller batches or deferring necessary conditioning, so a directional index goal should sit next to Throughput Rate or OEE results, which keeps the efficiency real rather than borrowed from output. In Natural Foods the metric fits less naturally, since that group's objectives are commercial, and it is best treated there as a supporting operational measure rather than a headline key result. Keep any target framed as the plant's own goal, not a cross-industry figure, since energy intensity depends heavily on process and product.
KPI Categories
This KPI is associated with the following categories and industries in our KPI database:


KPI Depot takes you from KPI intelligence to finished deliverable. Consultants, strategy teams, FP&A leaders, and analytics teams use it to answer the two hardest questions in performance management, what to measure and what the target should be, and then to produce the scorecard itself.
The difference is intelligence, not just data. Anyone can list metrics. Every KPI in KPI Depot carries 13 practical attributes, from formula and measurement approach to diagnostic questions, risk warnings, and Balanced Scorecard perspective, across 15 corporate functions and 153 industry-specific KPI groups. And every target you set is grounded in our database of 43,621 source-attributed benchmarks, each detailing metric value, company size, time period, industry, geography, sample size, and source. Benchmark data at this scale is otherwise the domain of research services costing thousands to hundreds of thousands of dollars per year.
When your metrics are selected, KPI Depot finishes the job: export an interactive Strategy Map, a Balanced Scorecard with formulas and tracking columns, or a CSV KPI pack, and go from research to working deliverable in hours instead of weeks.
Formerly the Flevy KPI Library, KPI Depot is trusted by teams at organizations including Accenture, EY, IBM, PepsiCo, Samsung, and Vodafone.
Got a question? Email us at [email protected]. For the full list of figures, see KPI Depot at a glance.
FAQs about Energy Efficiency Index
What factors influence the Energy Efficiency Index?
Key factors include the type of energy used, operational practices, and equipment efficiency. Regular monitoring and adjustments can also significantly impact the EEI.
How often should the EEI be assessed?
Quarterly assessments are recommended for most organizations. This frequency allows for timely adjustments and ensures alignment with energy-saving goals.
Can energy efficiency initiatives impact employee productivity?
Yes, improved energy management often leads to better working conditions, which can enhance employee morale and productivity. A comfortable environment supports higher performance levels.
What role does technology play in improving EEI?
Technology, such as smart meters and energy management systems, provides critical data for tracking and optimizing energy use. These tools enable organizations to make informed, data-driven decisions.
How can companies benchmark their EEI?
Companies can benchmark their EEI against industry standards or competitors. This comparison helps identify areas for improvement and sets realistic performance targets.
Is there a financial incentive for improving EEI?
Absolutely. Enhanced energy efficiency often leads to lower operational costs, improving overall financial health and ROI. Many governments also offer incentives for energy-saving initiatives.
Each KPI in our knowledge base includes 13 attributes.
KPI Definition
A clear explanation of what the KPI measures
Potential Business Insights
The typical business insights we expect to gain through the tracking of this KPI
Measurement Approach
An outline of the approach or process followed to measure this KPI
Standard Formula
The standard formula organizations use to calculate this KPI
Trend Analysis
Insights into how the KPI tends to evolve over time and what trends could indicate positive or negative performance shifts
Diagnostic Questions
Questions to ask to better understand your current position is for the KPI and how it can improve
Actionable Tips
Practical, actionable tips for improving the KPI, which might involve operational changes, strategic shifts, or tactical actions
Visualization Suggestions
Recommended charts or graphs that best represent the trends and patterns around the KPI for more effective reporting and decision-making
Risk Warnings
Potential risks or warnings signs that could indicate underlying issues that require immediate attention
Tools & Technologies
Suggested tools, technologies, and software that can help in tracking and analyzing the KPI more effectively
Integration Points
How the KPI can be integrated with other business systems and processes for holistic strategic performance management
Change Impact
Explanation of how changes in the KPI can impact other KPIs and what kind of changes can be expected
BSC Perspective
NEW Mapping to a Balanced Scorecard perspective (financial, customer, internal process, learning & growth)
Explore KPI Depot by Function & Industry

