Guest Incident Reports serve as a critical performance indicator for assessing customer satisfaction and operational efficiency.
By tracking incidents, organizations can identify areas for improvement, ultimately enhancing guest experiences and driving loyalty.
This KPI influences business outcomes such as customer retention, brand reputation, and operational effectiveness.
A robust reporting dashboard enables data-driven decision-making, allowing management to align strategies with guest expectations.
Regular analysis of incident reports can reveal trends that inform resource allocation and service enhancements.
Ultimately, this metric supports strategic alignment across departments, fostering a culture of continuous improvement.
Guest Incident Reports Interpretation
High values of Guest Incident Reports indicate potential service failures or operational inefficiencies, which can detract from the guest experience. Conversely, low values suggest effective service delivery and customer satisfaction. Ideal targets should reflect industry standards and organizational goals, aiming for a consistent downward trend in incident reports.
- <10 incidents per month – Strong performance; indicates high guest satisfaction
- 11–20 incidents per month – Monitor closely; assess service areas for improvement
- >20 incidents per month – Urgent attention required; investigate root causes
Guest Incident Reports Benchmarks
We have 4 relevant benchmarks in our benchmarks database.
Source: Subscribers only
Source Excerpt: Subscribers only
Additional Comments: Subscribers only
| Value | Unit | Type | Company Size | Time Period | Population | Industry | Geography | Sample Size |
| Subscribers only | percent of guests | share of respondents | Seven hotel segments | Stays between May 2010 and May 2011 | Hotel guests experiencing a problem, by problem type | Hotels / lodging | North America | more than 61,300 guests |
Compare KPI Depot Plans Login
Source: Subscribers only
Source Excerpt: Subscribers only
Additional Comments: Subscribers only
| Value | Unit | Type | Company Size | Time Period | Population | Industry | Geography | Sample Size |
| Subscribers only | percent of guests | share of respondents | Seven hotel segments | Stays between May 2010 and May 2011 | Hotel guests from Canada and the United States | Hotels / lodging | North America | more than 61,300 guests |
Compare KPI Depot Plans Login
Source: Subscribers only
Source Excerpt: Subscribers only
Additional Comments: Subscribers only
| Value | Unit | Type | Company Size | Time Period | Population | Industry | Geography | Sample Size |
| Subscribers only | percent of guests | share of respondents | 102 brands across nine market segments | Stays between May 2022 and May 2023 | Hotel guests | Hotels / lodging | North America | 33,754 hotel guests |
Compare KPI Depot Plans Login
Source: Subscribers only
Source Excerpt: Subscribers only
Additional Comments: Subscribers only
| Value | Unit | Type | Company Size | Time Period | Population | Industry | Geography | Sample Size |
| Subscribers only | percent of guests | average | 102 brands across nine hotel segments | Stays between May 2024 and May 2025 | Branded hotel guests | Hotels / lodging | North America | 39,219 branded hotel guests |
Compare KPI Depot Plans Login
Common Pitfalls
Many organizations misinterpret Guest Incident Reports, viewing them solely as a lagging metric rather than a tool for proactive improvement.
- Failing to categorize incidents can obscure underlying issues. Without clear classifications, it becomes challenging to identify trends or prioritize corrective actions effectively.
- Neglecting to follow up on reported incidents leads to unresolved issues. This can erode guest trust and diminish the perceived value of the reporting process.
- Overlooking feedback from frontline staff limits insights into service failures. Employees often have valuable perspectives on operational challenges that can inform better practices.
- Inconsistent reporting practices can skew data accuracy. Variations in how incidents are logged and analyzed create confusion and undermine the reliability of the KPI.






















Improvement Levers
Enhancing guest satisfaction through effective incident management requires a systematic approach to identifying and addressing service gaps.
- Implement a centralized reporting system to streamline incident logging. This ensures consistent data capture and facilitates easier analysis of trends over time.
- Conduct regular training sessions for staff on incident management best practices. Empowering employees with the right tools and knowledge can lead to quicker resolutions and improved guest interactions.
- Establish a feedback loop with guests to gather insights on their experiences. Actively seeking guest input can uncover issues that may not be visible through incident reports alone.
- Analyze incident data regularly to identify recurring patterns. This quantitative analysis can inform targeted interventions that improve overall service delivery.
Guest Incident Reports Case Study Example
A leading hotel chain faced increasing guest complaints, reflected in a rising number of Guest Incident Reports. Over a 12-month period, incidents escalated to an average of 35 per month, prompting concern among executives about brand reputation and guest loyalty. In response, the chain initiated a comprehensive review of its service protocols, focusing on training and operational efficiency. They implemented a new incident tracking system that allowed for real-time reporting and analysis, enabling staff to address issues promptly.
Within 6 months, the hotel chain reduced incident reports by 50%, significantly improving guest satisfaction scores. The management team utilized analytical insights from the data to refine service delivery and enhance staff training programs. By aligning operational practices with guest expectations, the chain not only improved its service quality but also increased repeat bookings.
The success of this initiative demonstrated the value of leveraging Guest Incident Reports as a key figure in driving operational improvements. The hotel chain's commitment to continuous monitoring and adjustment solidified its reputation as a guest-centric organization, ultimately leading to a stronger market position.
Related KPIs
KPI Categories
This KPI is associated with the following categories and industries in our KPI database:


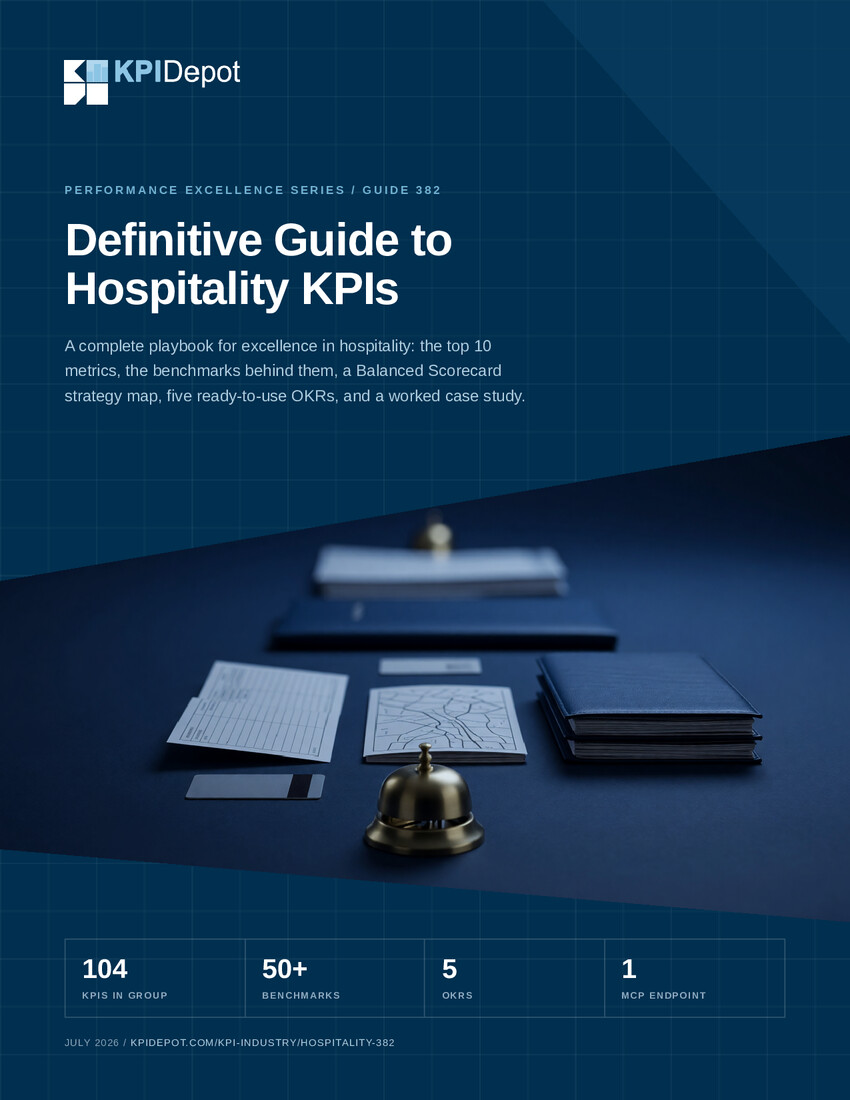
KPI Depot takes you from KPI intelligence to finished deliverable. Consultants, strategy teams, FP&A leaders, and analytics teams use it to answer the two hardest questions in performance management, what to measure and what the target should be, and then to produce the scorecard itself.
The difference is intelligence, not just data. Anyone can list metrics. Every KPI in KPI Depot carries 13 practical attributes, from formula and measurement approach to diagnostic questions, risk warnings, and Balanced Scorecard perspective, across 15 corporate functions and 153 industry-specific KPI groups. And every target you set is grounded in our database of 43,621 source-attributed benchmarks, each detailing metric value, company size, time period, industry, geography, sample size, and source. Benchmark data at this scale is otherwise the domain of research services costing thousands to hundreds of thousands of dollars per year.
When your metrics are selected, KPI Depot finishes the job: export an interactive Strategy Map, a Balanced Scorecard with formulas and tracking columns, or a CSV KPI pack, and go from research to working deliverable in hours instead of weeks.
Formerly the Flevy KPI Library, KPI Depot is trusted by teams at organizations including Accenture, EY, IBM, PepsiCo, Samsung, and Vodafone.
Got a question? Email us at [email protected]. For the full list of figures, see KPI Depot at a glance.
FAQs about Guest Incident Reports
What types of incidents are typically reported?
Common incidents include service delays, cleanliness issues, and staff interactions. Each category provides insights into specific areas needing improvement.
How often should incident reports be reviewed?
Regular reviews, ideally monthly, help identify trends and areas for improvement. Frequent analysis allows for timely adjustments to service practices.
Can incident reports impact employee performance evaluations?
Yes, incident reports can inform performance evaluations by highlighting areas where staff excel or need development. This can foster a culture of accountability and improvement.
What role does technology play in managing incidents?
Technology streamlines the reporting process, enabling real-time data capture and analysis. This enhances operational efficiency and supports data-driven decision-making.
How can we ensure guest feedback is effectively integrated?
Establishing structured feedback mechanisms allows for systematic collection and analysis of guest insights. This integration can lead to meaningful service enhancements.
Is it possible to benchmark our incident reports against competitors?
Benchmarking can be challenging due to varying reporting practices. However, industry standards can provide a useful reference point for assessing performance.
Each KPI in our knowledge base includes 13 attributes.
KPI Definition
A clear explanation of what the KPI measures
Potential Business Insights
The typical business insights we expect to gain through the tracking of this KPI
Measurement Approach
An outline of the approach or process followed to measure this KPI
Standard Formula
The standard formula organizations use to calculate this KPI
Trend Analysis
Insights into how the KPI tends to evolve over time and what trends could indicate positive or negative performance shifts
Diagnostic Questions
Questions to ask to better understand your current position is for the KPI and how it can improve
Actionable Tips
Practical, actionable tips for improving the KPI, which might involve operational changes, strategic shifts, or tactical actions
Visualization Suggestions
Recommended charts or graphs that best represent the trends and patterns around the KPI for more effective reporting and decision-making
Risk Warnings
Potential risks or warnings signs that could indicate underlying issues that require immediate attention
Tools & Technologies
Suggested tools, technologies, and software that can help in tracking and analyzing the KPI more effectively
Integration Points
How the KPI can be integrated with other business systems and processes for holistic strategic performance management
Change Impact
Explanation of how changes in the KPI can impact other KPIs and what kind of changes can be expected
BSC Perspective
NEW Mapping to a Balanced Scorecard perspective (financial, customer, internal process, learning & growth)
Explore KPI Depot by Function & Industry

