Inbound Call Handling Efficiency is crucial for optimizing customer interactions and operational efficiency.
This KPI directly influences customer satisfaction, retention rates, and overall financial health.
High efficiency in call handling can lead to reduced operational costs and improved ROI metrics.
By tracking this performance indicator, organizations can make data-driven decisions that align with strategic goals.
Effective management reporting and forecasting accuracy are essential for understanding trends and making timely adjustments.
Ultimately, improving this KPI enhances the customer experience and drives positive business outcomes.
How Inbound Call Handling Efficiency Connects to Your Strategy
Inbound Call Handling Efficiency belongs to KPI Depot's Inside Sales KPI group, where it sits well down the order, twenty-ninth among the group's forty-seven metrics. The headline positions are held by the money and funnel metrics: Sales Revenue leads, then Customer Acquisition Cost (CAC), then Conversion Rate, with Sales Cycle Length and Win Rate just behind. Against those, this metric is a process detail, the operational efficiency of working inbound calls rather than a top-line outcome the group is steering toward.
Its balanced scorecard placement is internal, which fits its role. It is a leading, activity-side measure: it describes how the team handles the calls that arrive, upstream of whether those calls convert. On its own it says nothing about deal quality or revenue, only about how efficiently the inbound flow is worked.
The tension worth naming is with Conversion Rate, third in the group and on the customer side. Handling calls more efficiently usually means moving through more of them per rep, and past a point that speed cuts into the discovery and qualification that turns an inbound call into a real opportunity. A rep who trims every call to lift handling efficiency can quietly lower the conversion the group actually cares about. Win Rate, fifth in the group, sits under the same pull. Efficiency read alone flatters activity; it earns its meaning only next to the conversion metrics above it.
Measuring Inbound Call Handling Efficiency in Practice
The formula is a composite, a sum of inbound call metrics divided by the number of calls handled, so its honesty depends entirely on what goes into the numerator and what counts as a handled call. The raw data lives in the telephony or ACD platform, which knows about queues, answers, hold, and talk time, while conversion and opportunity data lives in the CRM. Neither system alone can tell you whether an efficiently handled call became a real opportunity, so the two have to be joined on a call or lead identifier that they often record differently.
Settle the definitional forks before measuring:
- What counts as handled. Answered calls only, or every call offered including the ones that abandon in queue. The abandoned calls are exactly where an efficiency number can be made to look better than the experience was.
- What sits in the numerator. Talk time alone, or talk plus hold, or the full picture including after-call wrap-up. Each choice measures a different kind of efficiency, and blending teams that use different definitions produces a number no one can act on.
- Short and misrouted calls. Quick misdials and transfers that never reached a real conversation can inflate the count of handled calls and drag the average toward looking efficient.
Segmentation is where the metric becomes useful. Split by call type, since a new inbound lead and a callback on an existing opportunity are not the same work, by rep, and by time of day, because staffing and queue depth shift the numbers independently of skill. The instrumentation traps are specific. Transferred calls can be counted twice, once per agent who touched them, unless the platform is set to attribute a single handling event. After-call work is easy to leave uncaptured when reps do it off the system, which understates real handling effort. And an ACD that logs the call while the CRM never records an outcome will quietly build an efficiency picture that has no link to whether anything sold.
Common Pitfalls
Many organizations overlook the nuances of call handling, which can lead to misinterpretation of efficiency metrics.
- Neglecting to analyze call volume fluctuations can skew efficiency metrics. Seasonal spikes or drops in calls may require different staffing strategies to maintain performance levels.
- Failing to invest in training for call center staff can result in inconsistent service quality. Without proper training, agents may struggle to resolve issues effectively, leading to longer call times and customer dissatisfaction.
- Ignoring customer feedback can prevent organizations from addressing pain points. Without structured mechanisms to capture and act on complaints, systemic issues persist unnoticed.
- Overcomplicating call scripts can confuse agents and frustrate customers. Clear, concise scripts help ensure that agents can provide accurate information quickly, improving overall handling efficiency.
Improvement Levers
Enhancing inbound call handling efficiency requires a focus on both technology and human factors.
- Implement advanced call routing systems to direct inquiries to the right agents. This reduces wait times and improves first-call resolution rates, enhancing customer satisfaction.
- Regularly review and update training programs for call center staff. Ongoing training helps agents stay informed about products and services, enabling them to handle calls more effectively.
- Utilize analytics to track call patterns and identify peak times. This data-driven approach allows for better staffing decisions, ensuring adequate coverage during high-volume periods.
- Encourage a culture of continuous improvement by soliciting feedback from agents. Frontline employees often have valuable insights into operational inefficiencies that can be addressed to enhance performance.






















Inbound Call Handling Efficiency Benchmarks
We have 4 relevant benchmarks in our benchmarks database.
Source: Subscribers only
Source Excerpt: Subscribers only
| Value | Unit | Type | Company Size | Time Period | Population | Industry | Geography | Sample Size |
| Subscribers only | percent | calls | call center |
Compare KPI Depot Plans Login
Source: Subscribers only
Source Excerpt: Subscribers only
| Value | Unit | Type | Company Size | Time Period | Population | Industry | Geography | Sample Size |
| Subscribers only | percent | threshold | calls | call center |
Compare KPI Depot Plans Login
Source: Subscribers only
Source Excerpt: Subscribers only
| Value | Unit | Type | Company Size | Time Period | Population | Industry | Geography | Sample Size |
| Subscribers only | seconds | average | calls | contact centre | global |
Compare KPI Depot Plans Login
Source: Subscribers only
Source Excerpt: Subscribers only
Additional Comments: Subscribers only
| Value | Unit | Type | Company Size | Time Period | Population | Industry | Geography | Sample Size |
| Subscribers only | percent and seconds | threshold | calls | contact centre |
Compare KPI Depot Plans Login
Browse the Top Benchmarked KPIs in Inside Sales
Reading the Benchmarks for Inbound Call Handling Efficiency
The label call handling efficiency hides a real problem: the tracked sources do not measure the same thing under it. KPI Depot's sources here are contact-center references, and each one anchors on a different piece of the call. SQM Group's material centers on abandonment, calls that leave the queue before an agent answers, and separately on first call resolution, whether the issue was settled in one contact. Call Centre Helper's pieces look at queue position and waiting time, which are duration measures of what happens before and around the answer. An efficiency figure built from abandonment is not comparable to one built from first-contact resolution or from wait time, even though all three get filed under the same heading.
The denominator is the second fault line. Every source counts something over calls, but calls offered, calls answered, and calls handled are different populations, and abandonment lives precisely in the gap between them. A rate computed on answered calls omits the customers who gave up waiting, so it can look healthier than the same operation measured on offered calls. The wider field compounds this: average handle time, the most common efficiency construct, sums talk time, hold time, and after-call work, yet sources disagree on whether wrap-up work belongs in the total at all, and that single inclusion choice reshapes the number.
Context changes meaning as well. This KPI is defined for inside sales, converting inbound sales calls into opportunities, while the tracked sources describe service and support contact centers, where the goal is resolution rather than conversion. Call Centre Helper's guidance is framed globally and carries dates from earlier years, while SQM Group's is undated here, so era and region are not held constant across the set. Before trusting any outside call-handling figure, a customer has to know which sub-metric it came from, which call population sat in the denominator, and whether the setting was a sales desk or a support queue.
OKRs That Use Inbound Call Handling Efficiency
In the Inside Sales KPI group, Inbound Call Handling Efficiency fits the objective of empowering sales team productivity and effectiveness across the funnel, the same objective the group frames around sales productivity and call activity. It works there as a leading, activity-side key result: a team can commit to handling the inbound flow more efficiently as it lifts overall productivity. Because this KPI is internal and upstream, it belongs in an objective about how the team works, not one about revenue outcomes.
The group's own OKR guidance warns against exactly the failure mode this metric invites, treating raw activity as if it were progress. The bestpractice note is to pair activity measures with outcome measures so that more calls actually move deals rather than becoming busywork. So the sound framing sets this efficiency metric alongside Conversion Rate, drawn from the group's acquisition-efficiency objective, and keeps the key results directional: work the inbound flow more efficiently while conversion holds or improves, rather than chasing a fixed handling figure that a team could hit by rushing calls. Any handling target a team adopts is an internal productivity goal for its own desk, not a benchmark.
KPI Categories
This KPI is associated with the following categories and industries in our KPI database:


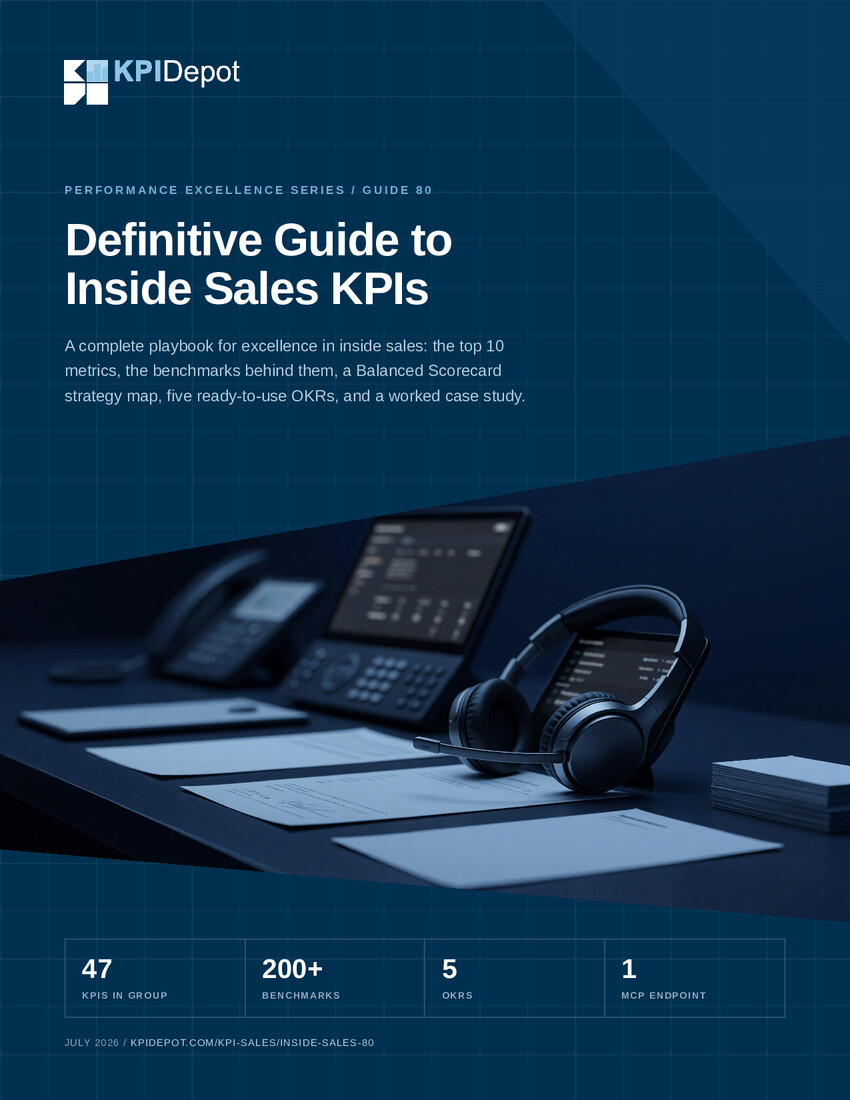
KPI Depot takes you from KPI intelligence to finished deliverable. Consultants, strategy teams, FP&A leaders, and analytics teams use it to answer the two hardest questions in performance management, what to measure and what the target should be, and then to produce the scorecard itself.
The difference is intelligence, not just data. Anyone can list metrics. Every KPI in KPI Depot carries 13 practical attributes, from formula and measurement approach to diagnostic questions, risk warnings, and Balanced Scorecard perspective, across 15 corporate functions and 153 industry-specific KPI groups. And every target you set is grounded in our database of 43,621 source-attributed benchmarks, each detailing metric value, company size, time period, industry, geography, sample size, and source. Benchmark data at this scale is otherwise the domain of research services costing thousands to hundreds of thousands of dollars per year.
When your metrics are selected, KPI Depot finishes the job: export an interactive Strategy Map, a Balanced Scorecard with formulas and tracking columns, or a CSV KPI pack, and go from research to working deliverable in hours instead of weeks.
Formerly the Flevy KPI Library, KPI Depot is trusted by teams at organizations including Accenture, EY, IBM, PepsiCo, Samsung, and Vodafone.
Got a question? Email us at [email protected]. For the full list of figures, see KPI Depot at a glance.
FAQs about Inbound Call Handling Efficiency
What is Inbound Call Handling Efficiency?
Inbound Call Handling Efficiency measures how effectively a call center manages incoming calls. It reflects the speed and quality of service provided to customers during their interactions.
Why is this KPI important?
This KPI is essential because it directly impacts customer satisfaction and retention. High efficiency can lead to reduced operational costs and improved financial ratios.
How can we improve our inbound call handling?
Improvements can be made through better training, advanced call routing systems, and regular analysis of call data. These strategies help ensure agents are well-prepared and that calls are handled promptly.
What are common challenges in achieving high efficiency?
Common challenges include fluctuating call volumes, inadequate training, and outdated technology. Addressing these issues is crucial for maintaining optimal performance levels.
How often should we review this KPI?
Regular reviews, ideally on a monthly basis, are recommended to identify trends and areas for improvement. Frequent monitoring allows for timely adjustments to strategies and processes.
Can technology help improve this KPI?
Yes, technology plays a vital role in enhancing inbound call handling efficiency. Tools like automated call distribution and analytics software can streamline processes and provide valuable insights.
Each KPI in our knowledge base includes 13 attributes.
KPI Definition
A clear explanation of what the KPI measures
Potential Business Insights
The typical business insights we expect to gain through the tracking of this KPI
Measurement Approach
An outline of the approach or process followed to measure this KPI
Standard Formula
The standard formula organizations use to calculate this KPI
Trend Analysis
Insights into how the KPI tends to evolve over time and what trends could indicate positive or negative performance shifts
Diagnostic Questions
Questions to ask to better understand your current position is for the KPI and how it can improve
Actionable Tips
Practical, actionable tips for improving the KPI, which might involve operational changes, strategic shifts, or tactical actions
Visualization Suggestions
Recommended charts or graphs that best represent the trends and patterns around the KPI for more effective reporting and decision-making
Risk Warnings
Potential risks or warnings signs that could indicate underlying issues that require immediate attention
Tools & Technologies
Suggested tools, technologies, and software that can help in tracking and analyzing the KPI more effectively
Integration Points
How the KPI can be integrated with other business systems and processes for holistic strategic performance management
Change Impact
Explanation of how changes in the KPI can impact other KPIs and what kind of changes can be expected
BSC Perspective
NEW Mapping to a Balanced Scorecard perspective (financial, customer, internal process, learning & growth)
Explore KPI Depot by Function & Industry

