Regulatory Compliance Score serves as a critical performance indicator that reflects an organization's adherence to legal and regulatory standards.
High compliance scores enhance financial health by minimizing risks associated with fines and legal actions.
This KPI influences business outcomes such as operational efficiency, risk management, and stakeholder trust.
Organizations with strong compliance frameworks often see improved forecasting accuracy and strategic alignment across departments.
By tracking this leading indicator, executives can make data-driven decisions that bolster overall performance.
Ultimately, a robust Regulatory Compliance Score can enhance a company's reputation and drive sustainable growth.
How Regulatory Compliance Score Connects to Your Strategy
Regulatory Compliance Score sits in four KPI groups, and its home is the Corporate Governance and Compliance Group, where it ranks second of fifty-one. Only Compliance Training Completion Rate outranks it there, and the score sits just ahead of Compliance Audit Completion Rate and Data Security and Privacy Compliance. That placement tells customers something specific: this is a headline outcome for the General Counsel view, read alongside the leading indicators that are supposed to move it.
Its balanced scorecard perspective is internal, and it behaves as a lagging measure. Compliance Training Completion Rate, the top-ranked co-metric in the same KPI group, carries a growth perspective and leads. That is the genuine tension to watch: training completion can climb while the compliance score stays flat, which points to training that is being logged rather than absorbed, or to an assessment that is not sensitive to the behaviors training was meant to change. A second real pull comes from Compliance Audit Completion Rate. If audits fall behind while the score holds steady, the steadiness may reflect narrowed audit scope rather than genuine control health.
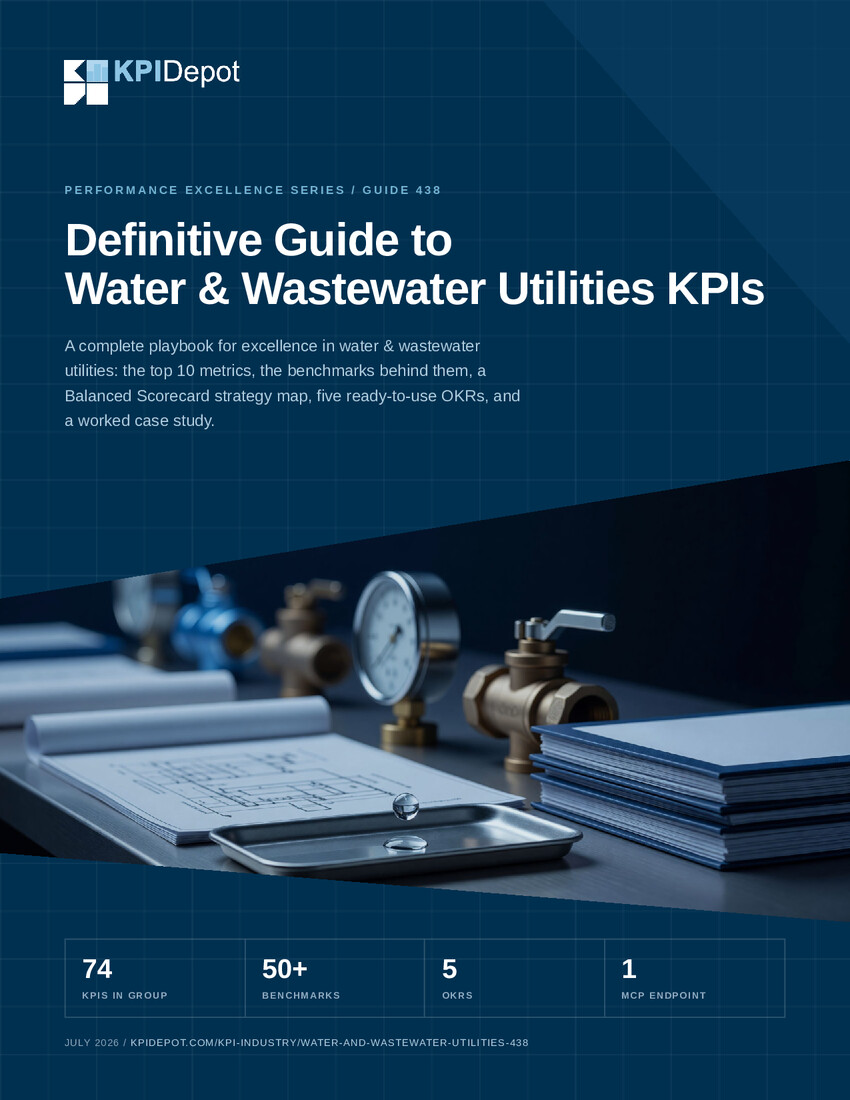
The same KPI appears with different neighbors elsewhere. In Water & Wastewater Utilities it ranks third of seventy-four, behind Water Quality Compliance Rate and Water Supply Reliability Index, where compliance is framed against operational reliability and public-health outcomes rather than legal filings. It also appears in Competitive Analysis, where it is a low-priority supporting metric well down the group, ranked twenty-third of forty behind market-facing co-metrics such as Market Share and Customer Acquisition Cost (CAC), and in Forestry and Paper Products, where it ranks fifty-first of seventy near Timber Harvest Volume and Deforestation Rate. Customers should treat the Corporate Governance reading as the primary one and the utilities and industry contexts as re-framings that change which co-metrics the score is judged against.
Measuring Regulatory Compliance Score in Practice
The canonical formula is a qualitative assessment score divided by the maximum possible score, expressed as a percentage. That structure means the number is only as trustworthy as the rubric behind it, so the assessment data lives wherever those reviews are recorded: audit management systems, GRC platforms, and the working papers of whoever scores the controls. Joining honestly means keeping the numerator and the maximum on the same version of the rubric. If the maximum possible score changes when new regulations are added, comparisons across periods break unless the earlier scores are restated on the new scale.
Several forks need to be settled before measuring. Decide whether the assessment is self-reported by control owners or independently reviewed, because the two produce systematically different scores. Decide the scope: whether the score covers all applicable regulations or only the ones assessed this cycle, since a high number can simply mean a narrow scope. Decide the cadence, because a score refreshed continuously and one refreshed once a period are not comparable even when they share a formula. The tracked sources show why segmentation matters here: the same metric name means something different in healthcare, financial services, and cross-industry settings, so customers should segment by regulatory regime and by business unit rather than reporting one blended company figure.
The instrumentation pitfalls are specific to a qualitative score. Rubric drift, where scorers grow more lenient or stricter over time, moves the number without any change in actual compliance. Weighting hides risk when a serious gap in one area is averaged away by strong scores elsewhere, so customers should inspect the component scores, not just the roll-up. And because the input is a judgment, inter-rater variation is real: two reviewers scoring the same evidence can disagree, so calibration across assessors is part of measuring this metric, not an afterthought.
Common Pitfalls
Many organizations underestimate the complexity of regulatory compliance, leading to gaps in adherence that can jeopardize financial stability and reputation.
- Failing to conduct regular compliance audits can create blind spots. Without periodic reviews, organizations may overlook changes in regulations or internal processes that affect compliance status.
- Neglecting employee training on compliance standards leads to inconsistent practices. Staff may not fully understand their roles in maintaining compliance, increasing the risk of violations.
- Overlooking the importance of a centralized compliance framework can result in fragmented efforts. Disparate departments may implement their own processes, causing misalignment and inefficiencies.
- Relying solely on manual compliance checks can introduce human error. Automation tools can enhance accuracy and streamline reporting, reducing the burden on staff.
Improvement Levers
Enhancing the Regulatory Compliance Score requires a proactive approach to risk management and continuous improvement.
- Implement a comprehensive compliance management system to centralize data and reporting. This system should facilitate real-time tracking of compliance metrics and regulatory changes.
- Conduct regular training sessions for employees to reinforce compliance protocols. Engaging staff through workshops and simulations can improve understanding and adherence.
- Establish a cross-functional compliance committee to ensure alignment across departments. This committee can oversee compliance initiatives and address potential issues collaboratively.
- Utilize data analytics to identify trends and areas for improvement. Quantitative analysis of compliance data can uncover insights that drive strategic adjustments.






















Regulatory Compliance Score Benchmarks
We have 3 relevant benchmarks in our benchmarks database.
Source: Subscribers only
Source Excerpt: Subscribers only
Additional Comments: Subscribers only
| Value | Unit | Type | Company Size | Time Period | Population | Industry | Geography | Sample Size |
| Subscribers only | percent | threshold | mid-market to enterprise | study year | organizations | cross-industry | global |
Compare KPI Depot Plans Login
Source: Subscribers only
Source Excerpt: Subscribers only
Additional Comments: Subscribers only
| Value | Unit | Type | Company Size | Time Period | Population | Industry | Geography | Sample Size |
| Subscribers only | percent | average | mixed | 2021 | healthcare organizations | healthcare | United States | 153 organizations |
Compare KPI Depot Plans Login
Source: Subscribers only
Source Excerpt: Subscribers only
Additional Comments: Subscribers only
| Value | Unit | Type | Company Size | Time Period | Population | Industry | Geography | Sample Size |
| Subscribers only | percent | percentiles | enterprise | 2022 | financial institutions | financial services | global | 236 organizations |
Compare KPI Depot Plans Login
Browse the Top Benchmarked KPIs in Corporate Governance and Compliance Group
Reading the Benchmarks for Regulatory Compliance Score
Three sources track a metric named Regulatory Compliance Score in the tracked set, and they do not measure the same thing. Deloitte reports at a cross-industry, global level for mid-market to enterprise organizations and frames its figure as a threshold. HIPAA Journal reports on healthcare organizations in the United States and frames its figure as an average. Thomson Reuters reports on financial institutions globally and frames its figure as percentiles. Publisher, population, industry, and the statistic type all differ, so a single number lifted from any one of them describes that population under that method, not compliance in general.
The definitional forks matter more than the labels suggest. A threshold answers whether an organization cleared a bar, an average answers what a middle organization looks like, and percentiles answer where an organization stands in a distribution. These are not interchangeable, and moving between them silently is where free numbers mislead. Population changes the meaning again: what counts as compliant for a healthcare entity under HIPAA is scoped to protected health information, while a financial-services reading is scoped to the obligations that regulator set. Geography compounds this, since a United States healthcare figure and a global financial-services figure answer different questions about different rulebooks.
Customers should treat this as limited triangulation rather than a consensus. One healthcare source, one financial-services source, and one cross-industry source do not corroborate each other; they are three separate measurements of a related but different construct. Before trusting any external figure a customer needs to confirm which population it covers, which statistic it reports, and whether the underlying definition of compliance matches the laws the customer is actually held to. The value of source-attributed data is that each of these can be checked; a bare number carries none of it.
OKRs That Use Regulatory Compliance Score
In the Corporate Governance and Compliance Group, the objective to ensure rigorous adherence to regulatory requirements with comprehensive audit and filing processes is where this KPI most naturally serves as a key result. The group's own OKR material lists Regulatory Compliance Score as a key result under that objective, sitting beside Compliance Audit Completion Rate, Regulatory Filing Timeliness, and Regulatory Inspection Readiness Rate. The sound framing is directional: a team commits to raising the score based on internal assessments over the period, with any specific target treated as an illustrative goal the team chooses rather than an external benchmark. Because the score is lagging, it works best as the outcome the leading key results are meant to move, not as the thing you push on directly.
A second framing comes from the utilities context, where the objective to enhance water safety and regulatory compliance to protect public health uses Regulatory Compliance Score as a key result alongside Water Quality Compliance Rate and Wastewater Treatment Compliance Rate. Here the score ladders to a public-health outcome rather than a legal-filing outcome, and the honest key result again describes direction, committing to improve the score through better monitoring and reporting processes without importing any from-and-to figures as if they were norms.
See OKR Examples for Corporate Governance and Compliance Group
KPI Categories
This KPI is associated with the following categories and industries in our KPI database:


KPI Depot takes you from KPI intelligence to finished deliverable. Consultants, strategy teams, FP&A leaders, and analytics teams use it to answer the two hardest questions in performance management, what to measure and what the target should be, and then to produce the scorecard itself.
The difference is intelligence, not just data. Anyone can list metrics. Every KPI in KPI Depot carries 13 practical attributes, from formula and measurement approach to diagnostic questions, risk warnings, and Balanced Scorecard perspective, across 15 corporate functions and 153 industry-specific KPI groups. And every target you set is grounded in our database of 43,621 source-attributed benchmarks, each detailing metric value, company size, time period, industry, geography, sample size, and source. Benchmark data at this scale is otherwise the domain of research services costing thousands to hundreds of thousands of dollars per year.
When your metrics are selected, KPI Depot finishes the job: export an interactive Strategy Map, a Balanced Scorecard with formulas and tracking columns, or a CSV KPI pack, and go from research to working deliverable in hours instead of weeks.
Formerly the Flevy KPI Library, KPI Depot is trusted by teams at organizations including Accenture, EY, IBM, PepsiCo, Samsung, and Vodafone.
Got a question? Email us at [email protected]. For the full list of figures, see KPI Depot at a glance.
FAQs about Regulatory Compliance Score
What is the importance of the Regulatory Compliance Score?
The Regulatory Compliance Score is crucial for assessing an organization's adherence to legal standards. A high score minimizes risks associated with penalties and enhances stakeholder trust.
How often should compliance be evaluated?
Regular evaluations should occur at least quarterly. However, organizations in rapidly changing industries may benefit from monthly assessments to stay ahead of regulatory shifts.
What are the consequences of low compliance scores?
Low compliance scores can lead to significant financial penalties and reputational damage. Organizations may also face operational disruptions and increased scrutiny from regulators.
Can technology improve compliance efforts?
Yes, technology plays a vital role in enhancing compliance efforts. Automated systems can streamline reporting, reduce errors, and provide real-time insights into compliance status.
How can employee training impact compliance?
Effective employee training is essential for maintaining compliance. Well-informed staff are more likely to adhere to regulations and recognize potential compliance issues.
What role does management play in compliance?
Management sets the tone for compliance culture within an organization. Strong leadership commitment to compliance fosters accountability and encourages staff to prioritize adherence to regulations.
Each KPI in our knowledge base includes 13 attributes.
KPI Definition
A clear explanation of what the KPI measures
Potential Business Insights
The typical business insights we expect to gain through the tracking of this KPI
Measurement Approach
An outline of the approach or process followed to measure this KPI
Standard Formula
The standard formula organizations use to calculate this KPI
Trend Analysis
Insights into how the KPI tends to evolve over time and what trends could indicate positive or negative performance shifts
Diagnostic Questions
Questions to ask to better understand your current position is for the KPI and how it can improve
Actionable Tips
Practical, actionable tips for improving the KPI, which might involve operational changes, strategic shifts, or tactical actions
Visualization Suggestions
Recommended charts or graphs that best represent the trends and patterns around the KPI for more effective reporting and decision-making
Risk Warnings
Potential risks or warnings signs that could indicate underlying issues that require immediate attention
Tools & Technologies
Suggested tools, technologies, and software that can help in tracking and analyzing the KPI more effectively
Integration Points
How the KPI can be integrated with other business systems and processes for holistic strategic performance management
Change Impact
Explanation of how changes in the KPI can impact other KPIs and what kind of changes can be expected
BSC Perspective
NEW Mapping to a Balanced Scorecard perspective (financial, customer, internal process, learning & growth)
Explore KPI Depot by Function & Industry

