Supplier Reliability Index (SRI) is a critical performance indicator that measures the consistency and dependability of suppliers in delivering goods and services.
High SRI values correlate with improved operational efficiency, reduced costs, and enhanced financial health.
Organizations with robust supplier reliability can better manage inventory levels and mitigate risks associated with supply chain disruptions.
By focusing on this KPI, companies can strategically align their sourcing strategies with business objectives, ultimately driving better business outcomes.
A strong SRI supports effective management reporting and data-driven decision-making, improving overall organizational performance.
How Supplier Reliability Index Connects to Your Strategy
Supplier Reliability Index is a supporting metric in every group it touches, and it touches three. Its highest-rank membership is FoodTech, where it sits twenty-ninth of one hundred, so read it there first. It also appears in Alcoholic Beverages at fifty-fifth of sixty-four, and in Pet Care at fifty-sixth of ninety-seven. Across all three it plays the same supporting role: a supply-side hygiene measure that protects the metrics customers actually lead with.
In FoodTech the headline co-metrics are Production Yield Rate at first, Food Safety Compliance Rate at second, and Food Waste Reduction Rate at third, followed by Customer Satisfaction Score (CSAT), Customer Retention Rate, Product Quality Index, Order Fulfillment Rate, and Supply Chain Efficiency. Supplier reliability feeds most of these from upstream: yield and fulfillment both depend on inputs arriving on time and in spec. In Alcoholic Beverages the leaders are Market Share, Brand Equity, Customer Lifetime Value (CLV), and Customer Retention Rate, with Product Margin Analysis and On-Premise vs. Off-Premise Sales further down. In Pet Care the front rank is Customer Retention Rate, Customer Lifetime Value (CLV), Customer Acquisition Cost (CAC), and Annual Revenue Growth. Its canonical BSC perspective is internal, so it is a leading indicator: supplier problems register here before they reach yield, fulfillment, and ultimately the customer and financial metrics above it.
The tension is worth stating plainly. A reliability index built from on-time delivery and quality tends to reward the most dependable suppliers, and the most dependable suppliers usually cost more, which pulls against margin metrics such as FoodTech's Profit Margin and Alcoholic Beverages' Product Margin Analysis. It can also pull against Supply Chain Efficiency in FoodTech: chasing a higher reliability score can push a team toward single-sourcing from the one proven supplier, which raises reliability on paper while concentrating risk and reducing the flexibility that efficiency depends on. Customers should hold the index against cost and against efficiency, not admire it on its own.
Measuring Supplier Reliability Index in Practice
Treat this as a composite index first and a formula second, because an index is only as trustworthy as its components and the weights you put on them. The canonical formula, reliable deliveries over total deliveries times one hundred, hides the real decision: what makes a delivery reliable. On-time delivery, defect or quality-rejection rate, fill rate, and supplier responsiveness are all candidate components, and each measures something different. Decide the components and the weighting honestly, and decide them before you measure, not after you see which suppliers you want to reward. Write the weights down and justify each one, because a weighting chosen to flatter an incumbent supplier is not a measurement, it is a conclusion dressed as one.
The consequence of composition is that two differently constructed indexes are not comparable. An index that weights on-time delivery heavily will rank suppliers differently from one that weights quality-rejection heavily, even over the same deliveries. So a Supplier Reliability Index from one company, division, or vendor tool cannot be read against another without first reconciling their components and weights, and any external figure is meaningless until you know how it was built. The same caution applies internally: if you change the weighting mid-year, the trend break is an artifact of your own definition, not a change in supplier behavior.
The data lives in procurement and receiving systems, where purchase-order promise dates meet goods-receipt records and quality-inspection results. Joining them honestly means matching each receipt to the commitment it was measured against, and agreeing what counts as a delivery: the purchase-order line, the shipment, or the pallet, since the denominator changes the whole score. Segment by supplier, by material category, and by site, because a blended index averages your reliable suppliers with your risky ones and hides exactly the concentration the metric is supposed to surface. The pitfall specific to a composite is component drift: if one underlying feed, say the on-time flag, degrades or changes definition, the whole index moves while looking stable, so audit the components on their own before trusting the roll-up.
Common Pitfalls
Many organizations overlook the importance of regular supplier evaluations, which can lead to deteriorating performance over time.
- Failing to establish clear performance metrics can create ambiguity in supplier expectations. Without defined KPIs, suppliers may not understand what constitutes success, leading to inconsistent outcomes.
- Neglecting to communicate with suppliers about performance issues can exacerbate problems. Open dialogue is essential for addressing concerns and fostering a collaborative relationship.
- Over-reliance on a limited supplier base can increase vulnerability to disruptions. Diversifying suppliers mitigates risks associated with single points of failure.
- Ignoring market changes and supplier capabilities can lead to misalignment. Regularly reassessing supplier performance in the context of evolving business needs is crucial for maintaining reliability.
Improvement Levers
Enhancing supplier reliability requires a proactive approach to performance management and relationship building.
- Implement regular performance reviews to assess supplier capabilities and reliability. These evaluations should include quantitative analysis of delivery times, quality metrics, and compliance with contractual obligations.
- Foster collaborative relationships with suppliers through open communication. Regular check-ins and feedback sessions can help identify issues early and facilitate continuous improvement.
- Utilize technology to track supplier performance in real-time. A reporting dashboard that aggregates key figures can provide insights into trends and areas needing attention.
- Develop contingency plans for critical suppliers to minimize disruption risks. Having alternative sources or backup plans in place can safeguard operations during unforeseen events.






















Supplier Reliability Index Benchmarks
We have 1 relevant benchmark in our benchmarks database.
Source: Subscribers only
Source Excerpt: Subscribers only
Formula: Subscribers only
Additional Comments: Subscribers only
| Value | Unit | Type | Company Size | Time Period | Population | Industry | Geography | Sample Size |
| Subscribers only | percent | median | mixed | supplier orders | cross-industry (all companies) | global | 4,648 companies |
Compare KPI Depot Plans Login
Browse the Top Benchmarked KPIs in FoodTech
OKRs That Use Supplier Reliability Index
In FoodTech, this index ladders to the group's real objective of increasing operational efficiency to maximize production output and cost control. That objective already pairs a higher Production Yield Rate with a higher Supply Chain Efficiency score and a higher Order Fulfillment Rate, and supplier reliability is the upstream condition for all three: inputs that arrive on time and in spec are what let yield and fulfillment improve. An illustrative team goal would raise the reliability index for a critical material category while yield and fulfillment climb, framed as a direction rather than a fixed target, so the index earns its keep by moving the metrics above it.
A second framing draws on FoodTech's objective of elevating product safety and regulatory compliance across all operations, which is built around Food Safety Compliance Rate, Ingredient Traceability, and a lower Product Recall Rate. Reliable, auditable suppliers are the backbone of traceability and recall response, so a supporting key result would tie improvements in the reliability index to gains in traceability coverage, keeping the safety objective grounded upstream. In Alcoholic Beverages the same logic maps to the group's objective of optimizing supply chain and logistics for resilience and cost leadership: supplier reliability underpins the Supply Chain Resilience key result, since resilience means dependable inputs even as the team develops alternative sourcing. Keep every target directional and drawn from the groups' own objectives, never from outside numbers.
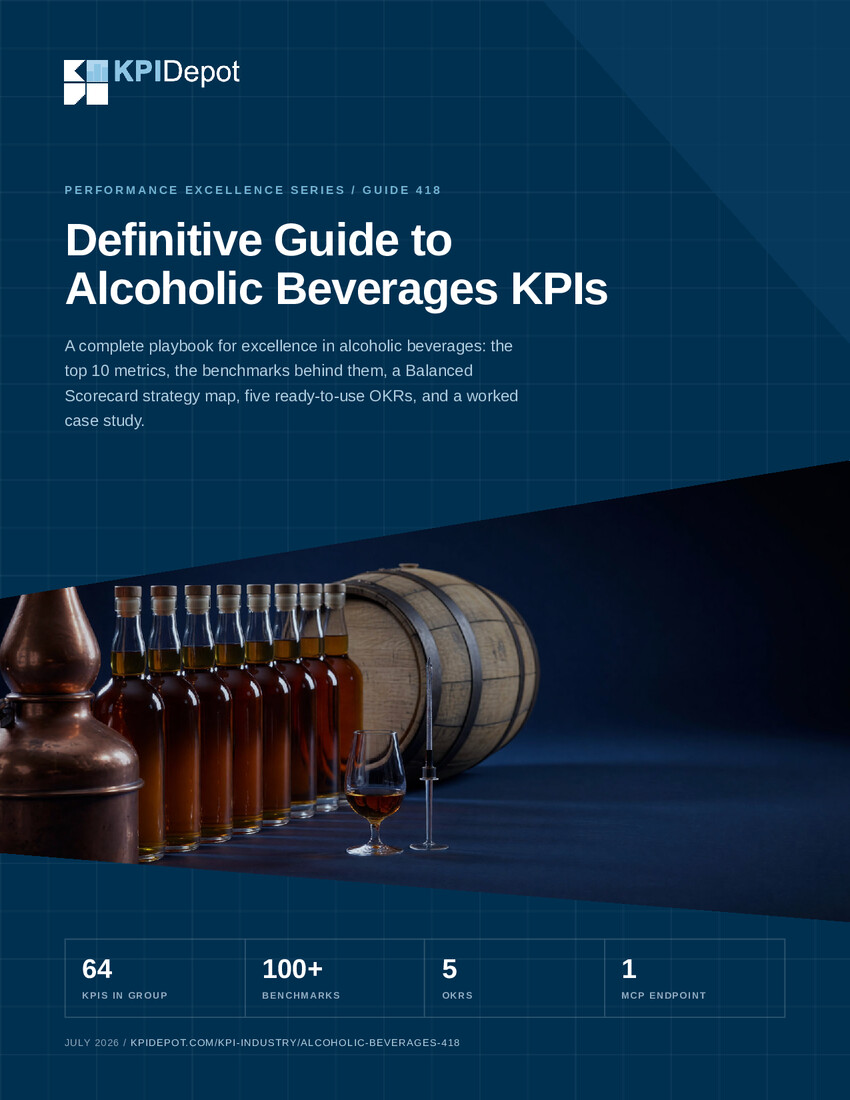
KPI Categories
This KPI is associated with the following categories and industries in our KPI database:


KPI Depot takes you from KPI intelligence to finished deliverable. Consultants, strategy teams, FP&A leaders, and analytics teams use it to answer the two hardest questions in performance management, what to measure and what the target should be, and then to produce the scorecard itself.
The difference is intelligence, not just data. Anyone can list metrics. Every KPI in KPI Depot carries 13 practical attributes, from formula and measurement approach to diagnostic questions, risk warnings, and Balanced Scorecard perspective, across 15 corporate functions and 153 industries. And every target you set is grounded in our database of 34,304 source-attributed benchmarks, each detailing metric value, company size, time period, industry, geography, sample size, and source. Benchmark data at this scale is otherwise the domain of research services costing thousands to hundreds of thousands of dollars per year.
When your metrics are selected, KPI Depot finishes the job: export an interactive Strategy Map, a Balanced Scorecard with formulas and tracking columns, or a CSV KPI pack, and go from research to working deliverable in hours instead of weeks.
Formerly the Flevy KPI Library, KPI Depot is trusted by teams at organizations including Accenture, EY, IBM, PepsiCo, Samsung, and Vodafone.
Got a question? Email us at [email protected].
FAQs about Supplier Reliability Index
What factors influence the Supplier Reliability Index?
Key factors include delivery performance, quality of goods, and responsiveness to issues. Each of these elements contributes to the overall reliability assessment of suppliers.
How often should suppliers be evaluated?
Regular evaluations, ideally quarterly, help maintain high standards. Frequent assessments allow organizations to address issues proactively and foster strong supplier relationships.
Can technology improve supplier reliability?
Yes, leveraging business intelligence tools can enhance visibility into supplier performance. Real-time data allows for quicker decision-making and more effective management of supplier relationships.
What role does communication play in supplier reliability?
Effective communication is crucial for addressing performance issues and aligning expectations. Regular updates and feedback can strengthen partnerships and improve overall reliability.
How can organizations benchmark supplier performance?
Organizations can benchmark by comparing SRI against industry standards or peer performance. This comparative analysis helps identify areas for improvement and best practices.
What are the consequences of poor supplier reliability?
Poor reliability can lead to production delays, increased costs, and diminished customer satisfaction. These factors can negatively impact overall business performance and profitability.
Each KPI in our knowledge base includes 13 attributes.
KPI Definition
A clear explanation of what the KPI measures
Potential Business Insights
The typical business insights we expect to gain through the tracking of this KPI
Measurement Approach
An outline of the approach or process followed to measure this KPI
Standard Formula
The standard formula organizations use to calculate this KPI
Trend Analysis
Insights into how the KPI tends to evolve over time and what trends could indicate positive or negative performance shifts
Diagnostic Questions
Questions to ask to better understand your current position is for the KPI and how it can improve
Actionable Tips
Practical, actionable tips for improving the KPI, which might involve operational changes, strategic shifts, or tactical actions
Visualization Suggestions
Recommended charts or graphs that best represent the trends and patterns around the KPI for more effective reporting and decision-making
Risk Warnings
Potential risks or warnings signs that could indicate underlying issues that require immediate attention
Tools & Technologies
Suggested tools, technologies, and software that can help in tracking and analyzing the KPI more effectively
Integration Points
How the KPI can be integrated with other business systems and processes for holistic strategic performance management
Change Impact
Explanation of how changes in the KPI can impact other KPIs and what kind of changes can be expected
BSC Perspective
NEW Mapping to a Balanced Scorecard perspective (financial, customer, internal process, learning & growth)
Explore KPI Depot by Function & Industry

